

Protein tyrosine phosphatase receptor type O (Ptpro) regulates cerebellar formation during zebrafish development through modulating Fgf signaling
- PMID: 23361036
- PMCID: PMC3676743
- DOI: 10.1007/s00018-013-1259-7
Protein tyrosine phosphatase receptor type O (Ptpro) regulates cerebellar formation during zebrafish development through modulating Fgf signaling
Abstract
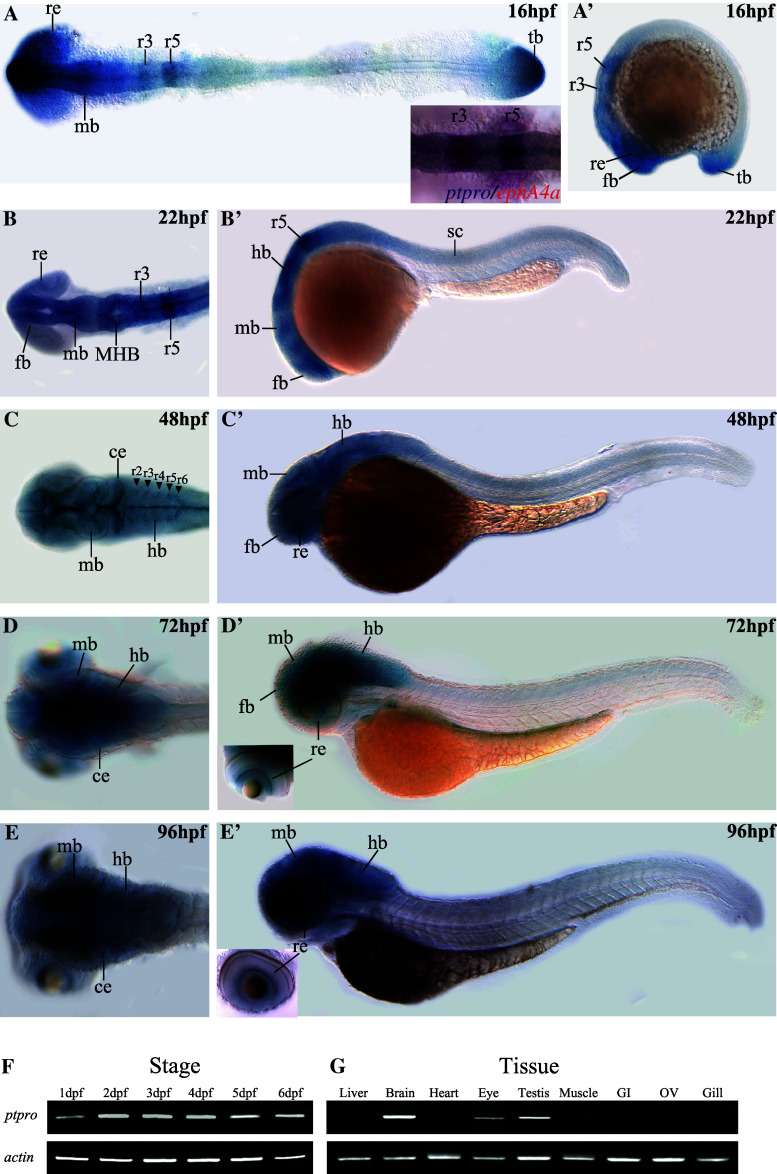
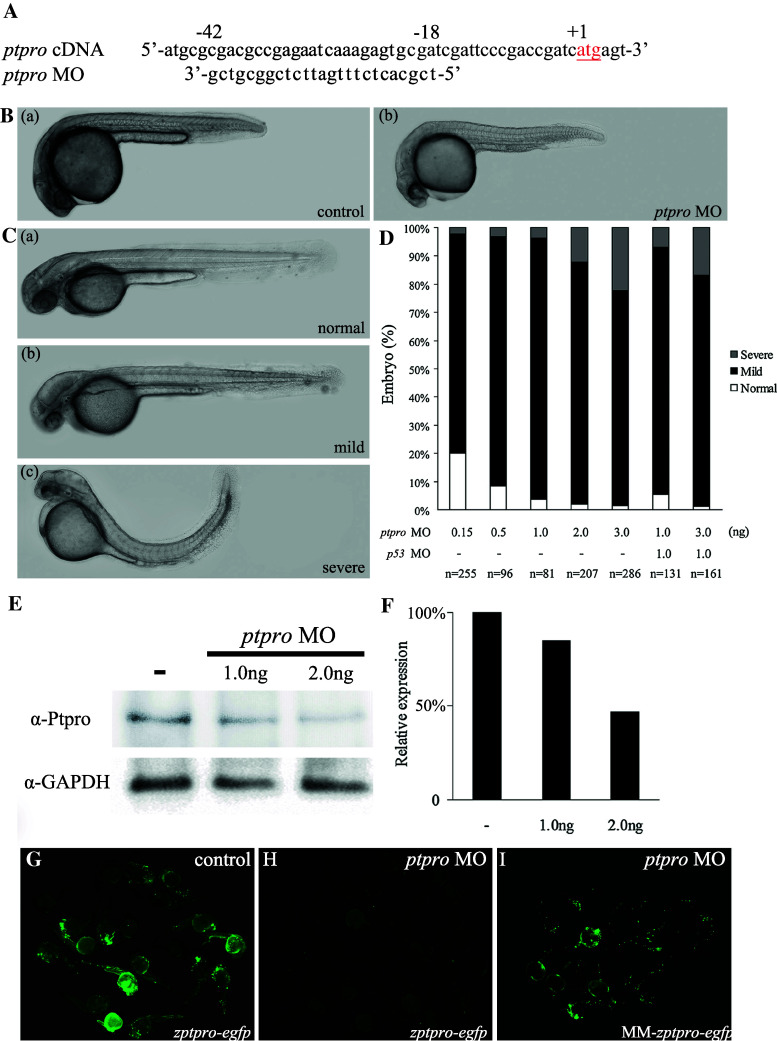
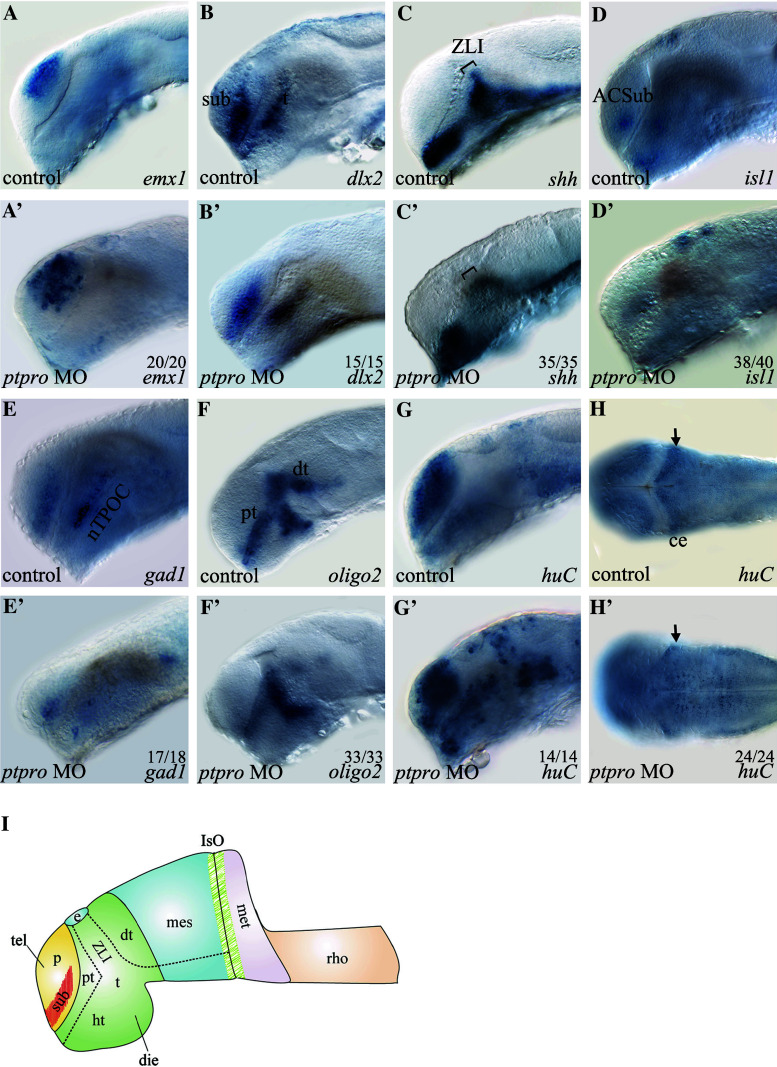
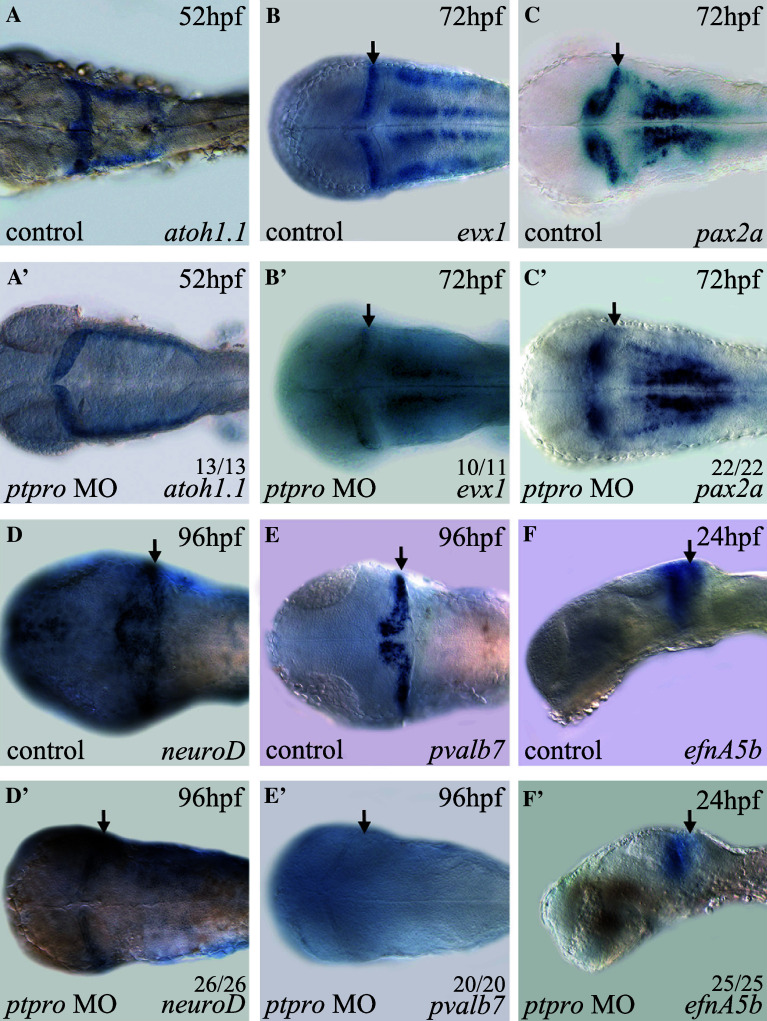
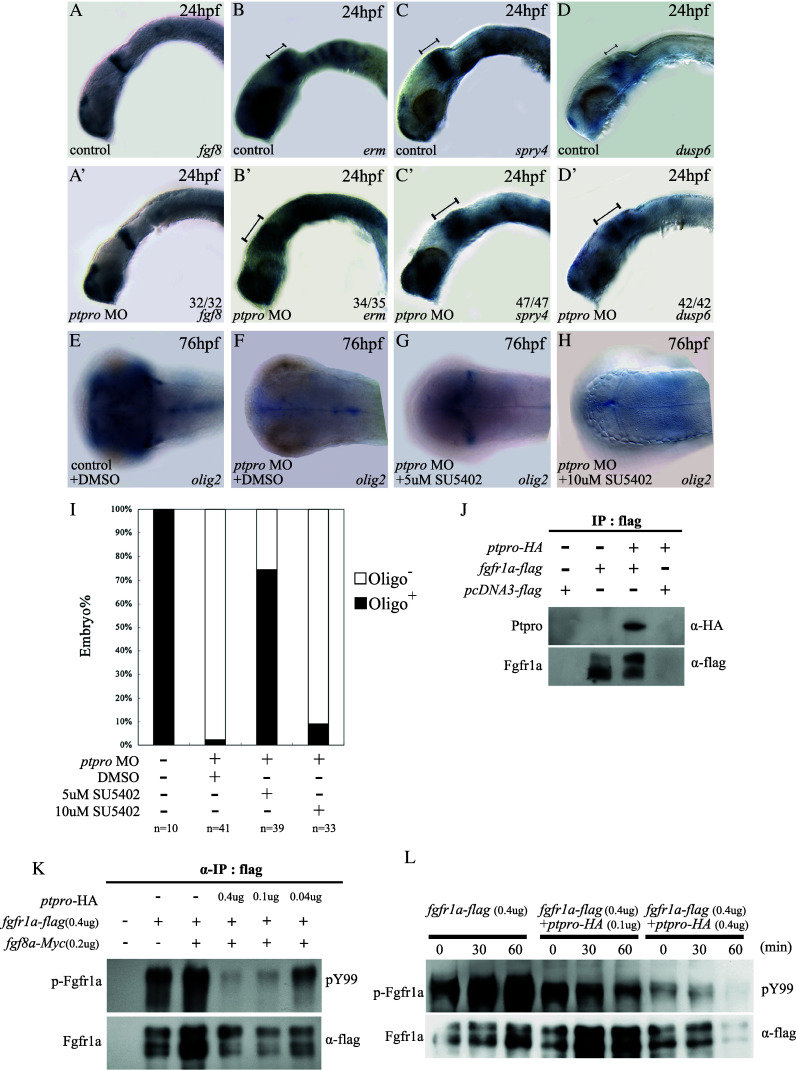
Protein activities controlled by receptor protein tyrosine phosphatases (RPTPs) play comparably important roles in transducing cell surface signals into the cytoplasm by protein tyrosine kinases. Previous studies showed that several RPTPs are involved in neuronal generation, migration, and axon guidance in Drosophila, and the vertebrate hippocampus, retina, and developing limbs. However, whether the protein tyrosine phosphatase type O (ptpro), one kind of RPTP, participates in regulating vertebrate brain development is largely unknown. We isolated the zebrafish ptpro gene and found that its transcripts are primarily expressed in the embryonic and adult central nervous system. Depletion of zebrafish embryonic Ptpro by antisense morpholino oligonucleotide knockdown resulted in prominent defects in the forebrain and cerebellum, and the injected larvae died on the 4th day post-fertilization (dpf). We further investigated the function of ptpro in cerebellar development and found that the expression of ephrin-A5b (efnA5b), a Fgf signaling induced cerebellum patterning factor, was decreased while the expression of dusp6, a negative-feedback gene of Fgf signaling in the midbrain-hindbrain boundary region, was notably induced in ptpro morphants. Further analyses demonstrated that cerebellar defects of ptpro morphants were partially rescued by inhibiting Fgf signaling. Moreover, Ptpro physically interacted with the Fgf receptor 1a (Fgfr1a) and dephosphorylated Fgfr1a in a dose-dependant manner. Therefore, our findings demonstrate that Ptpro activity is required for patterning the zebrafish embryonic brain. Specifically, Ptpro regulates cerebellar formation during zebrafish development through modulating Fgf signaling.
Figures
Similar articles
-
Cerebellar development in the absence of Gbx function in zebrafish.Dev Biol. 2014 Feb 1;386(1):181-90. doi: 10.1016/j.ydbio.2013.10.026. Epub 2013 Oct 30. Dev Biol. 2014. PMID: 24183937 Free PMC article.
-
Protein Tyrosine Phosphatase Receptor Type J (PTPRJ) Regulates Retinal Axonal Projections by Inhibiting Eph and Abl Kinases in Mice.J Neurosci. 2018 Sep 26;38(39):8345-8363. doi: 10.1523/JNEUROSCI.0128-18.2018. Epub 2018 Aug 6. J Neurosci. 2018. PMID: 30082414 Free PMC article.
-
SHIP2, a factor associated with diet-induced obesity and insulin sensitivity, attenuates FGF signaling in vivo.Dis Model Mech. 2010 Nov-Dec;3(11-12):733-42. doi: 10.1242/dmm.000703. Epub 2010 Jul 8. Dis Model Mech. 2010. PMID: 20616095 Free PMC article.
-
How does Fgf signaling from the isthmic organizer induce midbrain and cerebellum development?Dev Growth Differ. 2004 Dec;46(6):487-94. doi: 10.1111/j.1440-169x.2004.00769.x. Dev Growth Differ. 2004. PMID: 15610138 Review.
-
Maternal and zygotic control of zebrafish dorsoventral axial patterning.Annu Rev Genet. 2011;45:357-77. doi: 10.1146/annurev-genet-110410-132517. Epub 2011 Sep 13. Annu Rev Genet. 2011. PMID: 21942367 Review.
Cited by
-
Age-related decline in hippocampal tyrosine phosphatase PTPRO is a mechanistic factor in chemotherapy-related cognitive impairment.JCI Insight. 2023 Jul 24;8(14):e166306. doi: 10.1172/jci.insight.166306. JCI Insight. 2023. PMID: 37485875 Free PMC article.
-
R3 receptor tyrosine phosphatases: conserved regulators of receptor tyrosine kinase signaling and tubular organ development.Semin Cell Dev Biol. 2015 Jan;37:119-26. doi: 10.1016/j.semcdb.2014.09.005. Epub 2014 Sep 19. Semin Cell Dev Biol. 2015. PMID: 25242281 Free PMC article. Review.
-
Compulsive methamphetamine taking in the presence of punishment is associated with increased oxytocin expression in the nucleus accumbens of rats.Sci Rep. 2017 Aug 21;7(1):8331. doi: 10.1038/s41598-017-08898-8. Sci Rep. 2017. PMID: 28827541 Free PMC article.
-
Developmental roles of glomerular epithelial protein-1 in mice molar morphogenesis.Cell Tissue Res. 2024 Jan;395(1):53-62. doi: 10.1007/s00441-023-03841-y. Epub 2023 Nov 21. Cell Tissue Res. 2024. PMID: 37985496
-
Protein tyrosine phosphatase PTPRO represses lung adenocarcinoma progression by inducing mitochondria-dependent apoptosis and restraining tumor metastasis.Cell Death Dis. 2024 Jan 5;15(1):11. doi: 10.1038/s41419-023-06375-x. Cell Death Dis. 2024. PMID: 38182570 Free PMC article.
References
-
- Johnson KG, Van Vactor D. Receptor protein tyrosine phosphatases in nervous system development. Physiol Rev. 2003;83:1–24. - PubMed
-
- Murata Y, Mori M, Kotani T, Supriatna Y, Okazawa H, Kusakari S, Saito Y, Ohnishi H, Matozaki T. Tyrosine phosphorylation of R3 subtype receptor-type protein tyrosine phosphatases and their complex formations with Grb2 or Fyn. Genes cells: Devoted Mol Cell Mech. 2010;15:513–524. - PubMed
-
- Mori M, Murata Y, Kotani T, Kusakari S, Ohnishi H, Saito Y, Okazawa H, Ishizuka T, Matozaki T. Promotion of cell spreading and migration by vascular endothelial-protein tyrosine phosphatase (VE-PTP) in cooperation with integrins. J Cell Physiol. 2010;224:195–204. - PubMed
Publication types
MeSH terms
Substances
LinkOut - more resources
Full Text Sources
Other Literature Sources
Molecular Biology Databases
Miscellaneous
