Review
. 2012 Sep;32(4):374-400.
doi: 10.1055/s-0032-1331810. Epub 2013 Jan 29.

Advanced neuroimaging in traumatic brain injury

Affiliations
Review

Advanced neuroimaging in traumatic brain injury

Brian L Edlow et al. Semin Neurol. 2012 Sep.

Abstract

Advances in structural and functional neuroimaging have occurred at a rapid pace over the past two decades. Novel techniques for measuring cerebral blood flow, metabolism, white matter connectivity, and neural network activation have great potential to improve the accuracy of diagnosis and prognosis for patients with traumatic brain injury (TBI), while also providing biomarkers to guide the development of new therapies. Several of these advanced imaging modalities are currently being implemented into clinical practice, whereas others require further development and validation. Ultimately, for advanced neuroimaging techniques to reach their full potential and improve clinical care for the many civilians and military personnel affected by TBI, it is critical for clinicians to understand the applications and methodological limitations of each technique. In this review, we examine recent advances in structural and functional neuroimaging and the potential applications of these techniques to the clinical care of patients with TBI. We also discuss pitfalls and confounders that should be considered when interpreting data from each technique. Finally, given the vast amounts of advanced imaging data that will soon be available to clinicians, we discuss strategies for optimizing data integration, visualization, and interpretation.


Figures

Figure 1
Figure 1
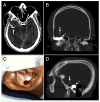
Head CT of penetrating TBI in a 22-year-old man with a right temporal gunshot wound. (A) Axial CT demonstrates bone fragments in the right temporal lobe (arrow), subdural hemorrhage and pneumocephalus anterior to the right temporal pole, and compression of the basal cisterns. Coronal (B) and sagittal (D) bone-windowed CT shows the bone fragments (solid arrows) and a focal hyperdensity, representing the bullet (dashed arrows), which is lodged in the temporal bone at the level of the middle ear canal adjacent to the mastoid air cells. The right temporal bone fracture explains the presence of bloody cerebrospinal fluid leaking out of the patient’s right ear (C).
Figure 2
Figure 2
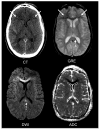
Comparison of CT, GRE, DWI, and ADC detection of traumatic axonal injury in a 19-year-old female pedestrian hit by a car. After a 5-minute loss of consciousness, the patient was inattentive and somnolent on arrival to the Emergency Department. CT was performed on the day of the injury, and MRI was performed seven days later. Only two traumatic microbleeds (TMBs) are seen on CT, whereas multiple TMBs are seen on GRE in the bifrontal white matter (solid arrows). Restricted diffusion is present throughout the genu of the corpus callosum, as indicated by hyperintense signal on DWI and hypointense signal on ADC. In addition, a smaller focus of diffusion restriction associated with a TMB is seen in the splenium of the corpus callosum (dashed arrows). Adapted with permission from Edlow and Diamond, Neurology 2010.
Figure 3
Figure 3
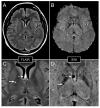
T2-FLAIR and SWI data from a 27-year-old man hit by a car while riding his bike. The patient’s admission Glasgow Coma Scale score was 7T (E1, M5, V1T), consistent with severe traumatic brain injury. MRI data were acquired one day post-injury. Hyperintense lesions on FLAIR (A, C), suggesting traumatic axonal injury (TAI), are seen in the posterior limb of the right internal capsule (solid arrow) and the fornix (dotted arrow). SWI data (B, D) reveal that each lesion is associated with a traumatic microbleed, suggesting hemorrhagic TAI. The lesions in the internal capsule and fornix provided a pathophysiologic basis for the patient’s left-sided hemiparesis and memory deficits, respectively, which were present on neurological examination at the time of hospital discharge to a rehabilitation facility. Zoomed views of the T2-FLAIR and SWI data are shown in (C, D).
Figure 4
Figure 4
GRE, Susceptibility Magnitude (Mag), Susceptibility Phase (Phase), and SWI data in a 23-year-old woman with severe TBI caused by a motor vehicle accident. The GRE data were acquired on post-TBI day 10 and the SWI, Mag, and Phase data were acquired 5 months post-TBI. A linear focus of hemorrhagic traumatic axonal injury (TAI) located at the midline of the dorsal tegmentum of the pons (solid arrow) is barely perceptible on GRE, but is clearly detectable on SWI. Similarly, a second focus of hemorrhagic TAI in the right dorsolateral quadrant of the pontine tegmentum adjacent to the 4th ventricle (dashed arrow) is difficult to discern on GRE but is clearly demonstrated by SWI. Of note, although the GRE and SWI data were acquired at different times post-injury, the paramagnetic properties of blood are expected to provide similar signal contrast at 10 days and 5 months post-TBI.
Figure 5
Figure 5
DTI and diffusion tensor tractography in a 32-year-old healthy man. Greyscale FA map (A), color-coded FA map (B), and color-coded principle eigenvector (i.e. tensor) map (C) are displayed in the axial plane at the level of the mid-thalami. A diffusion tensor tractography analysis is shown in (D) from a posterior perspective, superimposed on the axial color FA map shown in (B). In (A), the signal intensity of the FA map corresponds to the magnitude of the FA in each voxel, on a scale from 0 (black) to 1 (white). In (B, C, and D), color-coding is according to convention, with medial-lateral fibers coded red, anterior-posterior fibers coded green, and superior-inferior fibers coded blue. In (D), fiber tracts were reconstructed with TrackVis software using a deterministic, streamline tractography model. Tract termination criteria included FA < 0.2 and intervoxel angle curvature > 60 degrees. Fiber tracts in the splenium were generated using a single voxel region of interest (ROI) that was manually traced at the center of the splenium. Fiber tracts in the bilateral posterior limbs of the internal capsule (PL IC) were also generated using single voxel ROIs traced at the centers of the PL IC. Tracts in the genu were generated using a single voxel ROI traced in the forceps minor fasciculus of the right frontal lobe.
Figure 6
Figure 6
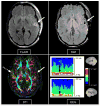
Multimodal advanced neuroimaging analysis of language deficits in a 20-year-old man with moderate TBI (admission Glasgow Coma Scale score = 9) due to an assault. The patient underwent urgent elevation of a depressed left fronto-temporo-parietal skull fracture prior to MRI data acquisition, which was performed on post-TBI day 2 with a 3 Tesla Siemens Skyra MRI scanner. EEG data were acquired on post-TBI day 1 using a standard 10–20 electrode placement. T2-FLAIR, SWI, and DTI (color FA) data are shown in the axial plane at the level of the superior temporal gyrus (Wernicke’s area). EEG power spectrograms are shown for the left (top) and right (bottom) hemispheres, representing EEG data acquired over a 10-minute epoch. In the left superior temporal gyrus (solid arrows), the multimodal imaging data show the following constellation of findings: edema on T2-FLAIR, multiple traumatic microbleeds (TMBs) on SWI (which were not detected by T2-FLAIR); and a relative absence of arcuate fasciculus fibers on the DTI color FA map, as compared to the contralateral superior temporal gyrus (dashed arrow). On the EEG spectrograms, time is represented on the x-axis, frequency is represented on the y-axis, and the color-coding indicates the power of each frequency at each time point (power units = square root of microvolts). In this patient, frequencies in the theta (4 to 8 Hz) and alpha (8 to 13 Hz) range are present with equal power in the left and right hemispheres. However, delta slowing (< 4 Hz) occurs with much greater power in the left hemisphere, as indicated by the bright white band in the delta frequency range (solid black arrow), as compared to the red-yellow band in the right hemisphere’s delta range (dashed black arrow). This left-sided delta slowing on EEG corresponds to the left temporal lobe injury revealed by the multimodal imaging data, as well as the mixed expressive and receptive aphasia that were observed on the patient’s neurological examination.
Figure 7
Figure 7
HARDI tractography and fMRI of the left-sided peri-Sylvian language network in a 27-year-old man with severe TBI caused by a motorcycle accident. Despite extensive contusions, traumatic axonal injury (TAI), skull fractures, subdural and epidural hemorrhages causing acute traumatic coma and requiring urgent right-sided hemicraniectomy, the patient regained the ability to express and understand language prior to hospital discharge. The HARDI data (A) and fMRI data (B, C) were acquired on post-TBI day 16. HARDI tractography analysis using the left arcuate fasciculus as a seed region of interest demonstrates structural connectivity between Wernicke’s area in the superior temporal gyrus and Broca’s area in the inferior frontal gyrus. In addition, there is preserved arcuate fasciculus connectivity with Geschwind’s area, which is comprised of Brodmann areas 39 and 40 within the inferior parietal lobe, as described by Catani et al. Consistent with these structural connectivity findings, BOLD fMRI analysis during a passive language paradigm (the subject listened to a spoken narrative while in the MRI scanner) demonstrated activation within Wernicke’s area (B) and Broca’s area (C). HARDI and fMRI data were acquired on a 3 Tesla Siemens Skyra MRI scanner using a 32-channel head coil. The HARDI sequence utilized 60 directional diffusion gradients applied at a b value of 2000 sec/mm2 and with a voxel size of 2 × 2 × 2 mm. Tractography reconstructions were performed with TrackVis software using a deterministic, streamline algorithm and a tract termination threshold of intervoxel angle curvature > 60 degrees (no FA threshold). The fMRI analysis was performed using FEAT (FMRI Expert Analysis Tool) Version 5.98, part of FSL (FMRIB’s Software Library, www.fmrib.ox.ac.uk/fsl). Z (Gaussianised T/F) statistic images were thresholded using clusters determined by Z>2.3 and a (corrected) cluster significance threshold of P=0.05 (see color bar inset, in which the color intensity corresponds to the Z score).
Figure 8
Figure 8
Resting state fMRI (rs-fMRI) analysis of default mode network (DMN) connectivity in a 17-year-old boy with mild TBI due to a sports concussion, as compared to a gender- and age-matched control subject. Rs-fMRI analysis of DMN connectivity was performed using a seed region placed in the precuneus (Pr) using techniques previously described. A sagittal view of DMN connectivity in the left hemisphere is shown in the top row using MRIcroGL, with red color indicating positive resting correlations in the BOLD signal and green color indicating negative correlations in the BOLD signal (see inset). In the control subject, functional connectivity is observed between the medial prefrontal cortex (MPFC) and the Pr and posterior cingulate (PC), whereas in the TBI patient, the MPFC is functionally disconnected from the posterior nodes of the DMN. A coronal view of DMN functional connectivity is shown in the bottom row at the level of the posterior parietal lobe, using the same Pr region of interest. Functional connectivity between the Pr and the bilateral inferior parietal lobules (IPL) is present in the control subject but not in the TBI patient.

Similar articles

Cited by

References

    1. Faul M, Xu L, Wald MM, Coronado VG. Traumatic brain injury in the United States: emergency department visits, hospitalizations and deaths 2002–2006. Atlanta (GA): Centers for Disease Control and Prevention, National Center for Injury Prevention and Control; 2010.
    1. Tanielian TL, Jaycox L Rand Corporation. Invisible wounds of war: psychological and cognitive injuries, their consequences, and services to assist recovery. Santa Monica, CA: RAND; 2008. p. xliii.p. 453.
    1. Ommaya AK, Gennarelli TA. Cerebral concussion and traumatic unconsciousness. Correlation of experimental and clinical observations of blunt head injuries. Brain. 1974;97(4):633–654. - PubMed
    1. Shaw NA. The neurophysiology of concussion. Prog Neurobiol. 2002;67(4):281–344. - PubMed
    1. Ropper AH, Gorson KC. Clinical practice. Concussion N Engl J Med. 2007;356(2):166–172. - PubMed

Publication types