

A novel fluorescent lipid probe for dry eye: retrieval by tear lipocalin in humans
- PMID: 23361507
- PMCID: PMC3597195
- DOI: 10.1167/iovs.12-10817
A novel fluorescent lipid probe for dry eye: retrieval by tear lipocalin in humans
Abstract
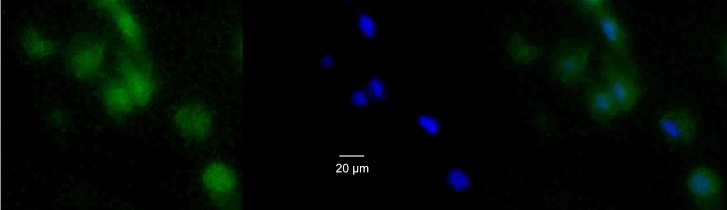
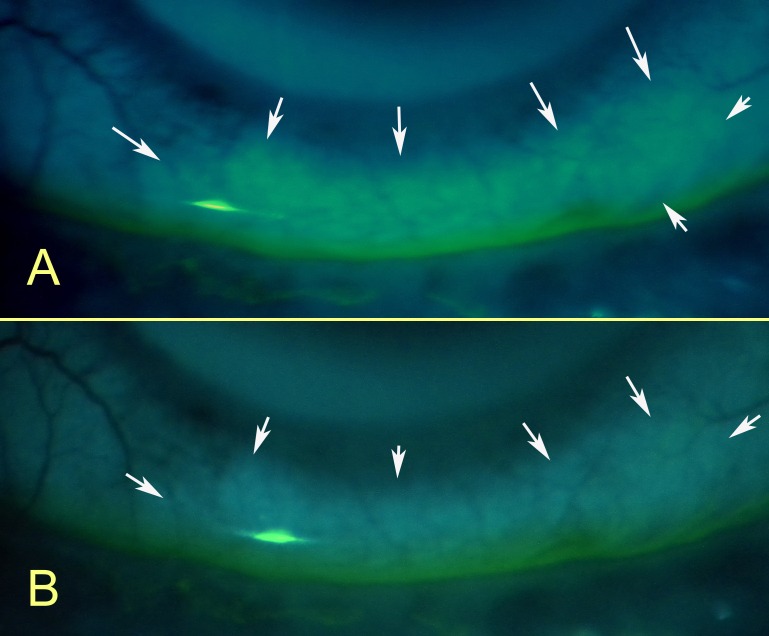
Purpose: A fluorescent probe was used to identify mucin-depleted areas on the ocular surface and to test the hypothesis that tear lipocalin retrieves lipids from the eyes of normal and dry eye subjects.
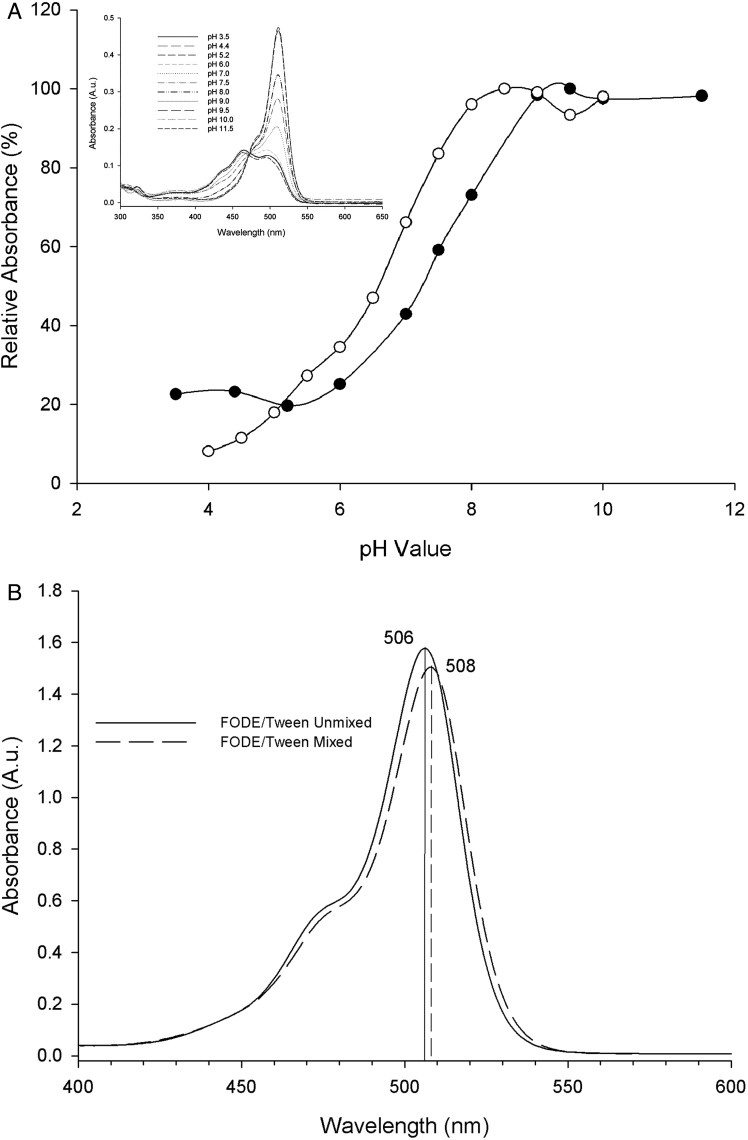
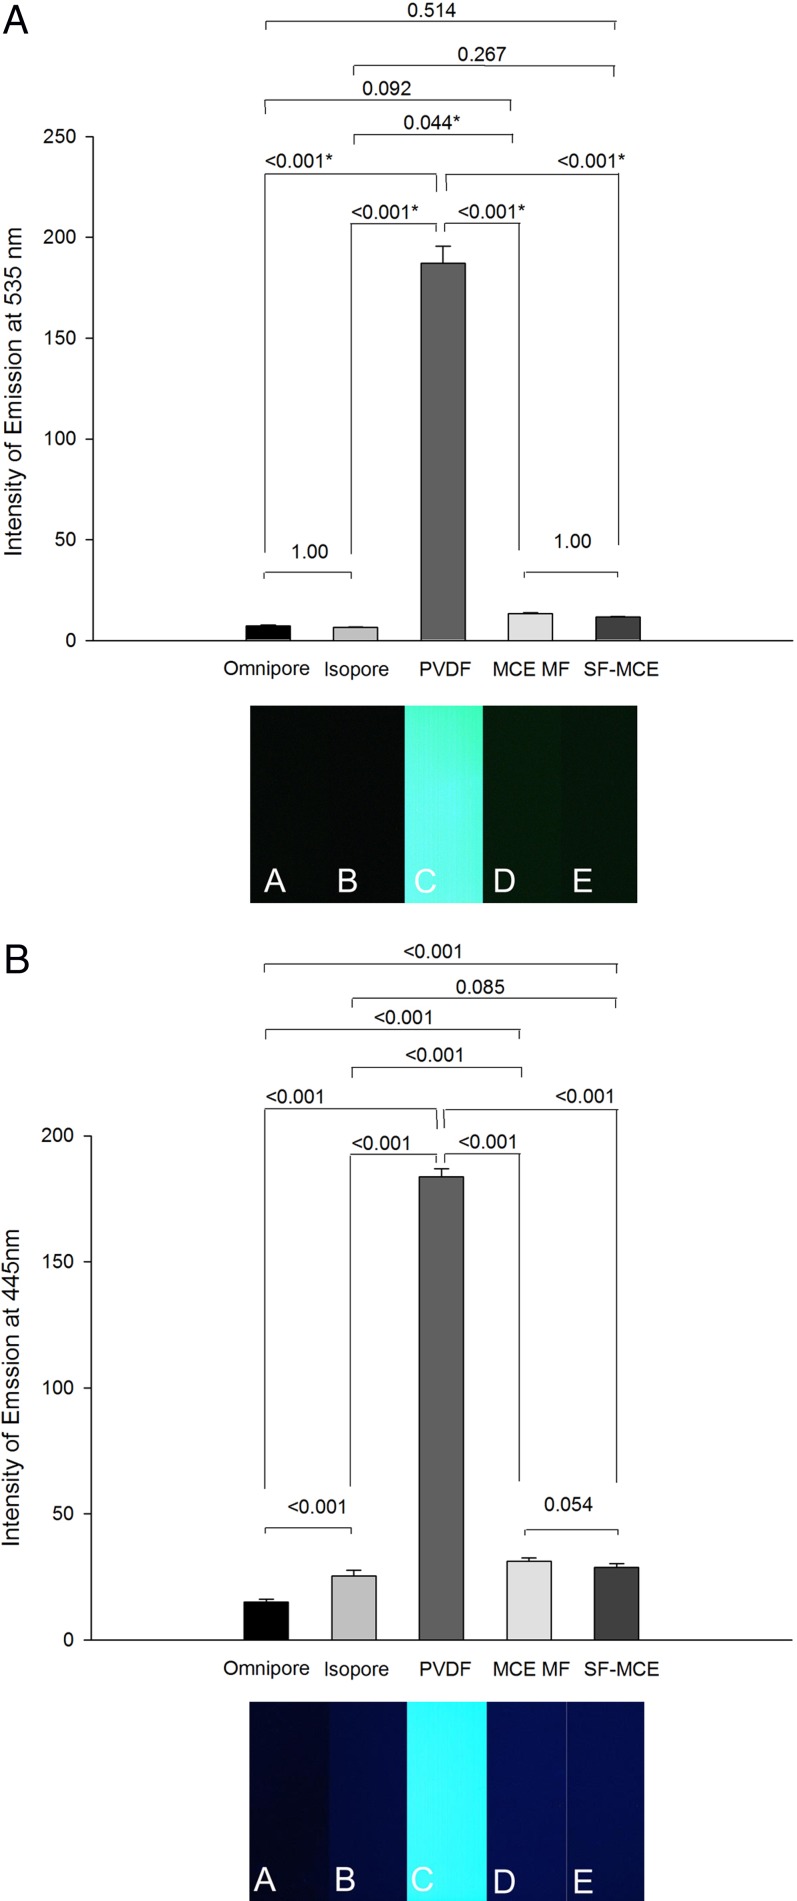
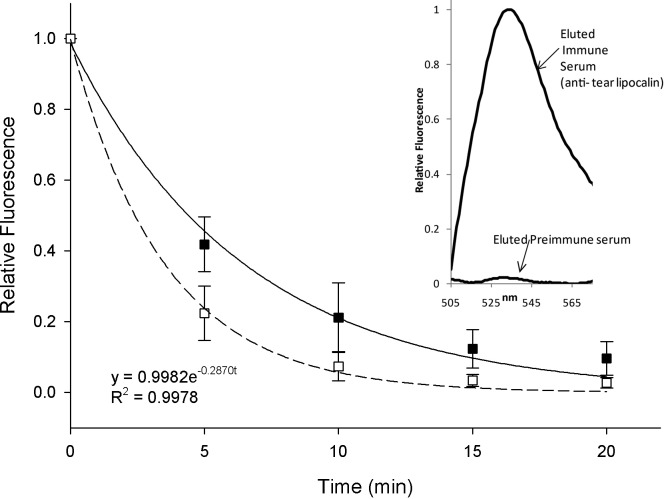
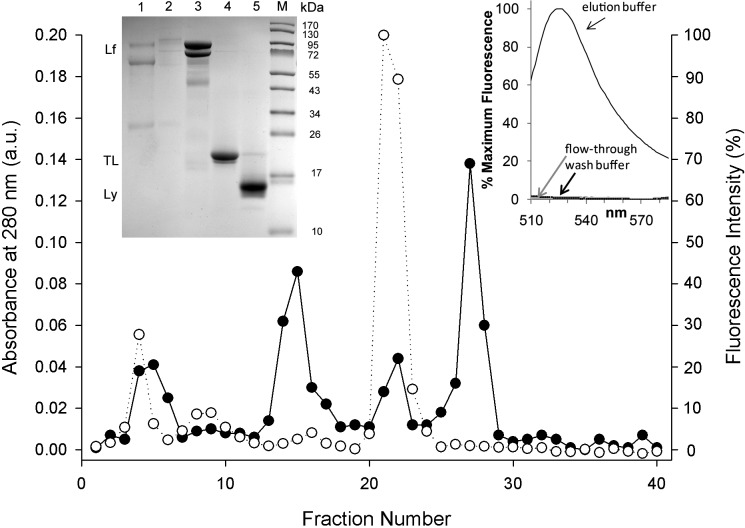
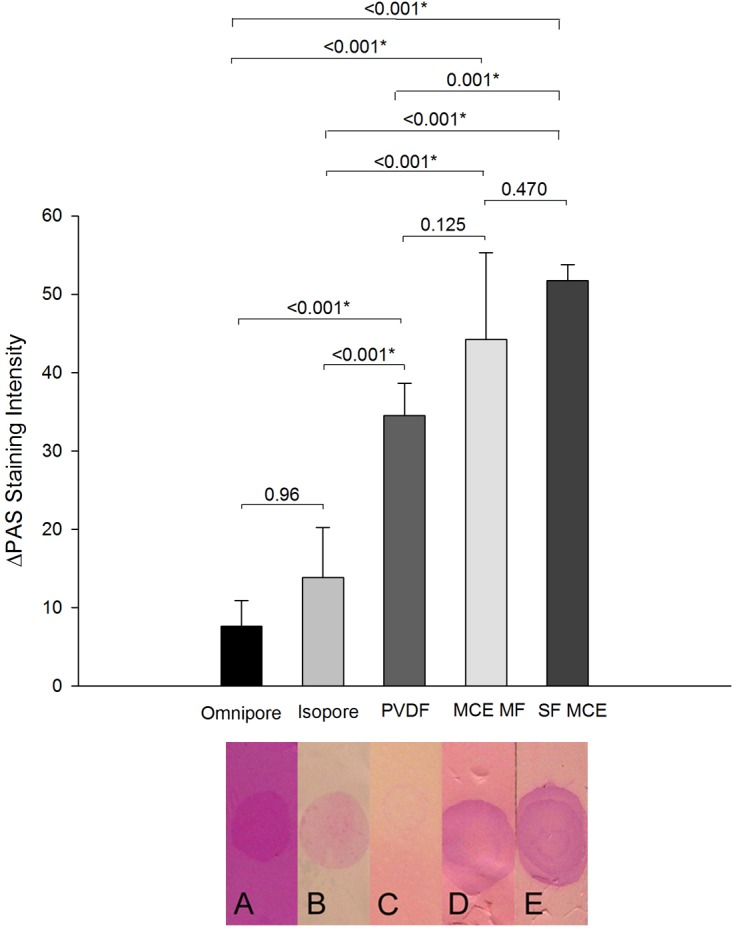
Methods: Fluorescein-labeled octadecyl ester, FODE, was characterized by mass spectrometry and absorbance spectrophotometry. The use of FODE to define mucin defects was studied with impression membranes under conditions that selectively deplete mucin. The kinetics of FODE removal from the ocular surface were analyzed by sampling tears from control and dry eye patients at various times. The tear protein-FODE complexes were isolated by gel filtration and ion exchange chromatographies, monitored with absorption and fluorescent spectroscopies, and analyzed by gel electrophoresis. Immunoprecipitation verified FODE complexed to tear lipocalin in tears.
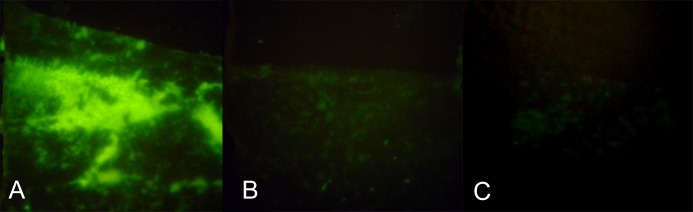
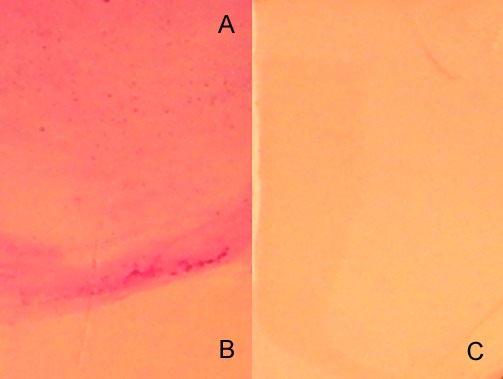
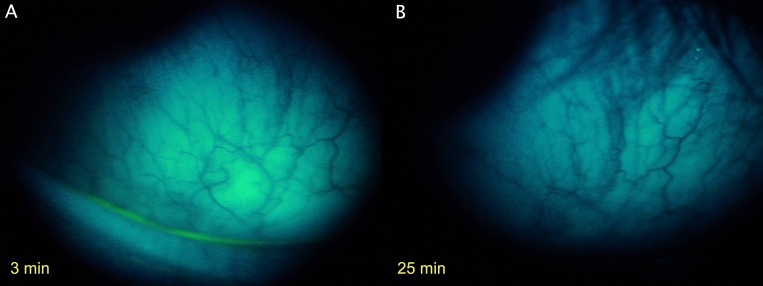
Results: FODE exhibits an isosbestic point at 473 nm, pKa of 7.5, and red shift relative to fluorescein. The low solubility of FODE in buffer is enhanced with 1% Tween 80 and ethanol. FODE adheres to the ocular surface of dry eye patients. FODE produces visible staining at the contact sites of membranes, which correlates with removal of mucin. Despite the fact that tear lipocalin is reduced in dry eye patients, FODE removal follows similar rapid exponential decay functions for all subjects. FODE is bound to tear lipocalin in tears.
Conclusions: Tear lipocalin retrieves lipid rapidly from the human ocular surface in mild to moderate dry eye disease and controls. With improvements in solubility, FODE may have potential as a fluorescent probe to identify mucin-depleted areas.
Conflict of interest statement
Disclosure:
Figures


Similar articles
-
Tear lipocalin captures exogenous lipid from abnormal corneal surfaces.Invest Ophthalmol Vis Sci. 2010 Apr;51(4):1981-7. doi: 10.1167/iovs.09-4622. Epub 2009 Dec 3. Invest Ophthalmol Vis Sci. 2010. PMID: 19959641 Free PMC article.
-
Tear lipocalin, lysozyme and lactoferrin concentrations in postmenopausal women.J Med Life. 2015;8 Spec Issue(Spec Issue):94-8. J Med Life. 2015. PMID: 26366224 Free PMC article.
-
Diquafosol sodium ophthalmic solution for the treatment of dry eye: clinical evaluation and biochemical analysis of tear composition.Jpn J Ophthalmol. 2015 Nov;59(6):415-20. doi: 10.1007/s10384-015-0408-y. Epub 2015 Aug 27. Jpn J Ophthalmol. 2015. PMID: 26310103
-
Lacritin and the tear proteome as natural replacement therapy for dry eye.Exp Eye Res. 2013 Dec;117:39-52. doi: 10.1016/j.exer.2013.05.020. Epub 2013 Jun 12. Exp Eye Res. 2013. PMID: 23769845 Free PMC article. Review.
-
Short Tear Film Breakup Time-Type Dry Eye.Invest Ophthalmol Vis Sci. 2018 Nov 1;59(14):DES64-DES70. doi: 10.1167/iovs.17-23746. Invest Ophthalmol Vis Sci. 2018. PMID: 30481808 Review.
Cited by
-
Tear Lipocalin and Lipocalin-Interacting Membrane Receptor.Front Physiol. 2021 Aug 19;12:684211. doi: 10.3389/fphys.2021.684211. eCollection 2021. Front Physiol. 2021. PMID: 34489718 Free PMC article.
-
Dry eye syndrome: developments and lifitegrast in perspective.Clin Ophthalmol. 2018 Jan 15;12:125-139. doi: 10.2147/OPTH.S126668. eCollection 2018. Clin Ophthalmol. 2018. PMID: 29391773 Free PMC article. Review.
-
Lipocalins Are Required for Apical Extracellular Matrix Organization and Remodeling in Caenorhabditis elegans.Genetics. 2017 Oct;207(2):625-642. doi: 10.1534/genetics.117.300207. Epub 2017 Aug 25. Genetics. 2017. PMID: 28842397 Free PMC article.
-
Glucose-sensitive silicone hydrogel contact lens toward tear glucose monitoring.J Biomed Opt. 2018 May;23(5):1-9. doi: 10.1117/1.JBO.23.5.057005. J Biomed Opt. 2018. PMID: 29774672 Free PMC article.
-
Once-Daily Topical Phosphosulindac Is Efficacious in the Treatment of Dry Eye Disease: Studies in Rabbit Models of Its Main Clinical Subtypes.J Ocul Pharmacol Ther. 2022 Jan-Feb;38(1):102-113. doi: 10.1089/jop.2021.0050. Epub 2021 Dec 29. J Ocul Pharmacol Ther. 2022. PMID: 34964663 Free PMC article.
References
-
- Gipson IK. Distribution of mucins at the ocular surface. Exp Eye Res. 2004; 78: 379–388 - PubMed
-
- Gipson IK, Argueso P. Role of mucins in the function of the corneal and conjunctival epithelia. Int Rev Cytol. 2003; 231: 1–49 - PubMed
-
- Gipson IK, Inatomi T. Cellular origin of mucins of the ocular surface tear film. Adv Exp Med Biol. 1998; 438: 221–227 - PubMed
-
- Argueso P, Gipson IK. Epithelial mucins of the ocular surface: structure, biosynthesis and function. Exp Eye Res. 2001; 73: 281–289 - PubMed
-
- Argueso P, Spurr-Michaud S, Russo CL, Tisdale A, Gipson IK. MUC16 mucin is expressed by the human ocular surface epithelia and carries the H185 carbohydrate epitope. Invest Ophthalmol Vis Sci. 2003; 44: 2487–2495 - PubMed
Publication types
MeSH terms
Substances
Grants and funding
LinkOut - more resources
Full Text Sources
Other Literature Sources
Medical
