. 2013 Mar 15;288(11):7738-7755.
doi: 10.1074/jbc.M112.428078. Epub 2013 Jan 28.

Inhibition of G-protein-coupled receptor kinase 2 (GRK2) triggers the growth-promoting mitogen-activated protein kinase (MAPK) pathway

Affiliations

Inhibition of G-protein-coupled receptor kinase 2 (GRK2) triggers the growth-promoting mitogen-activated protein kinase (MAPK) pathway

Xuebin Fu et al. J Biol Chem. .

Abstract

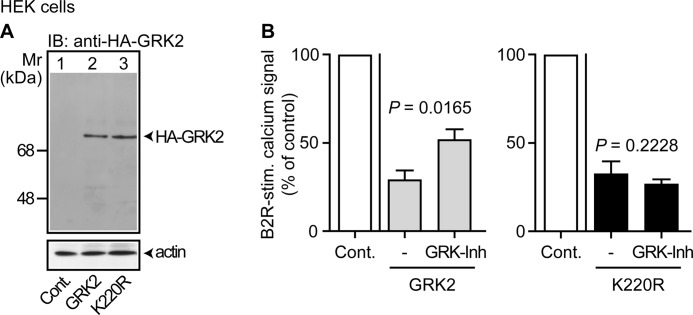
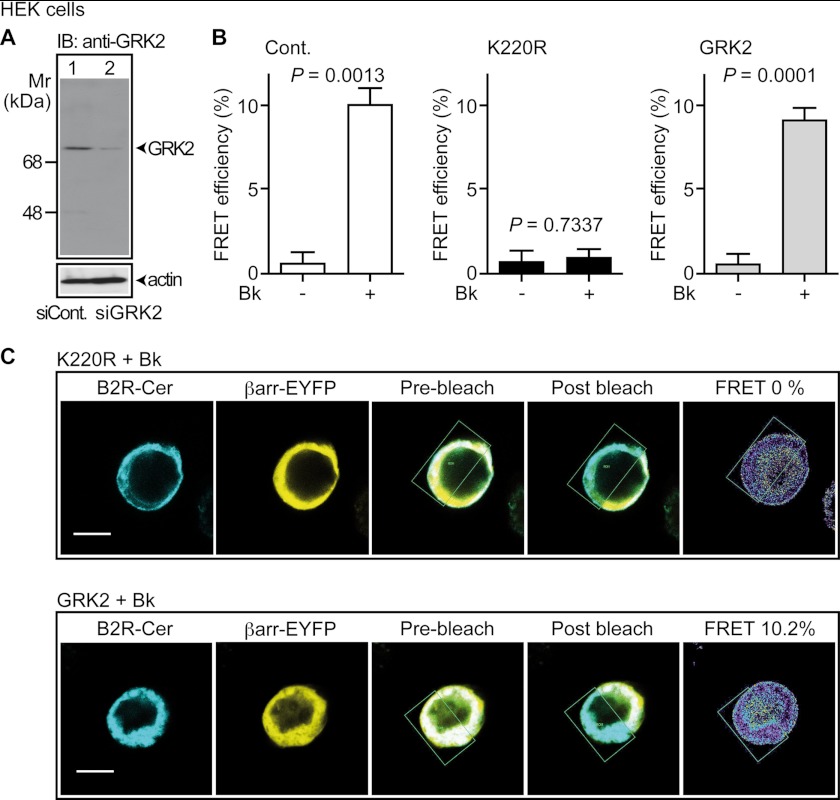
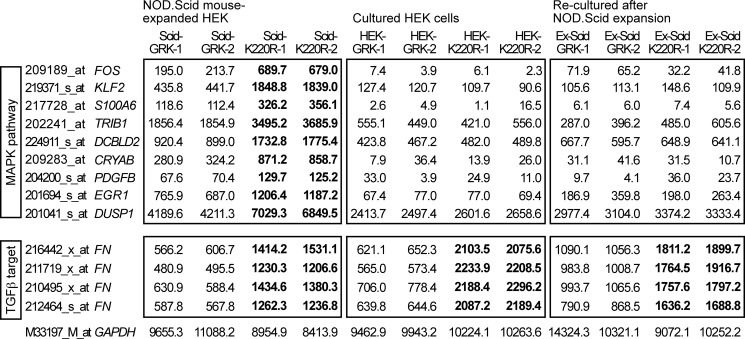
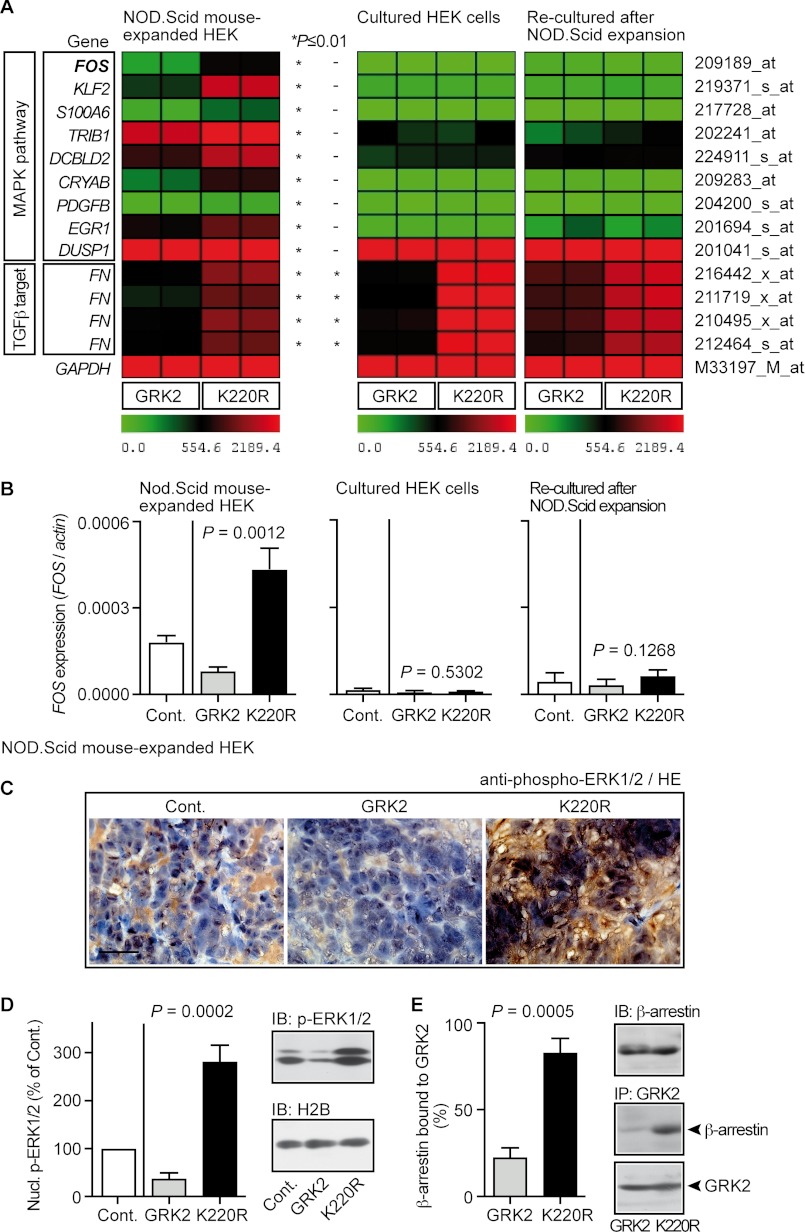
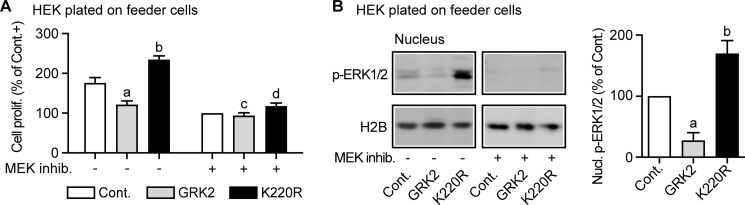
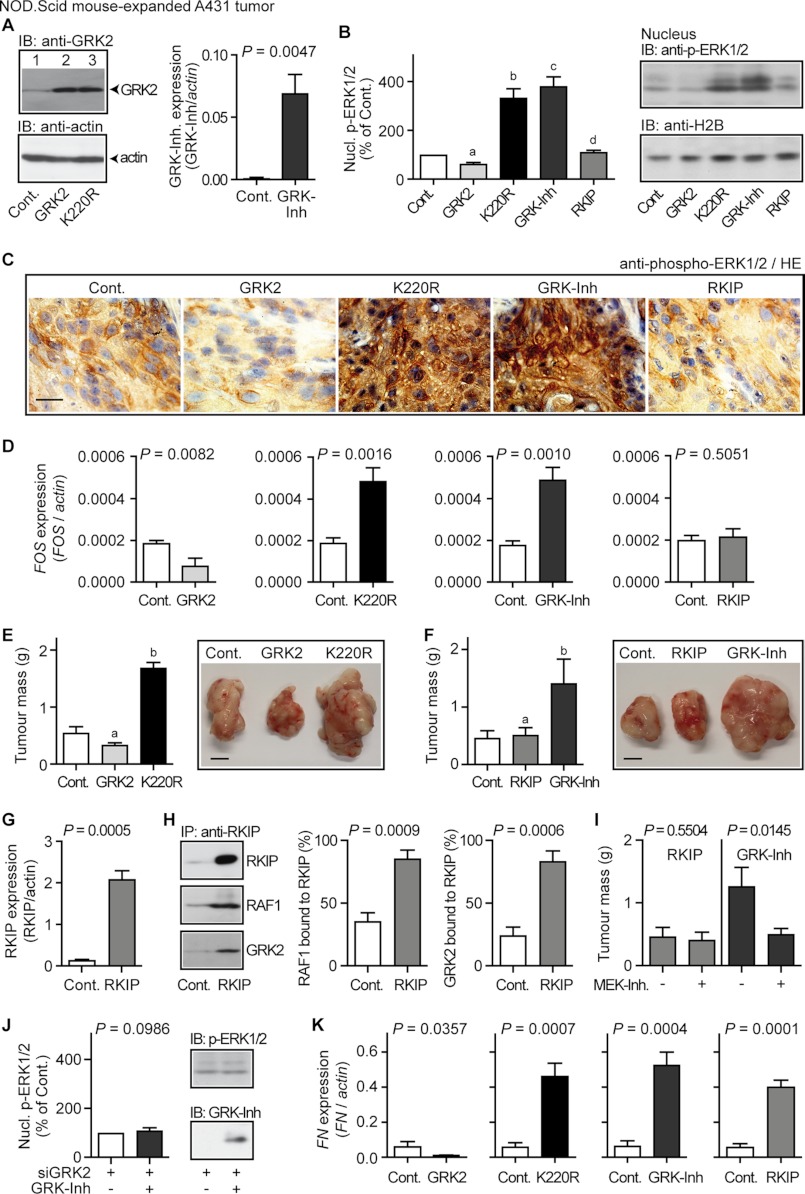
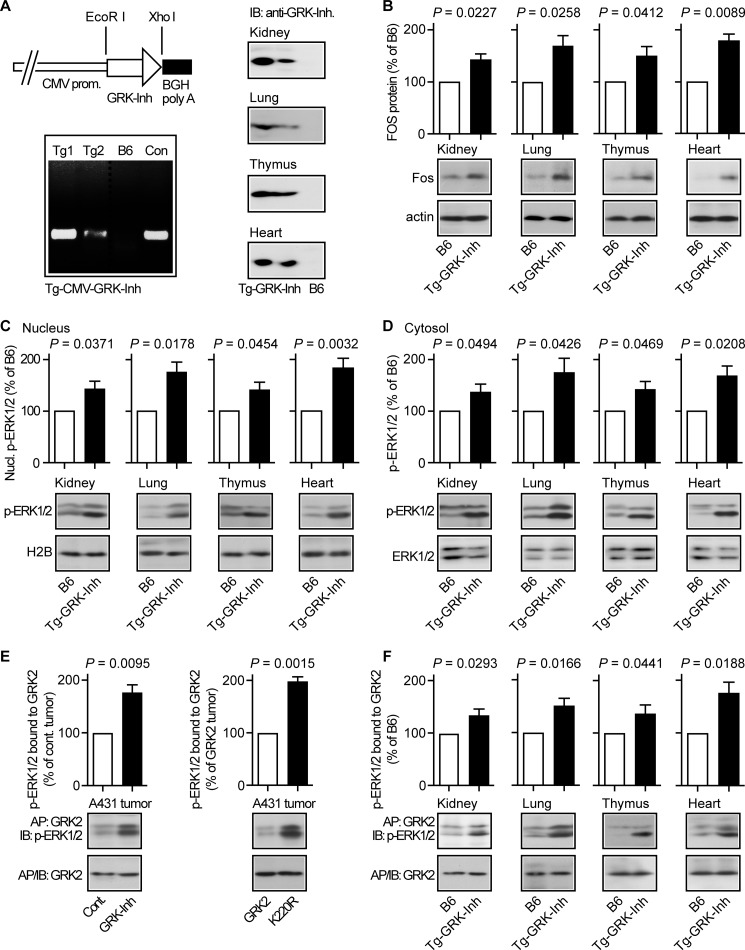
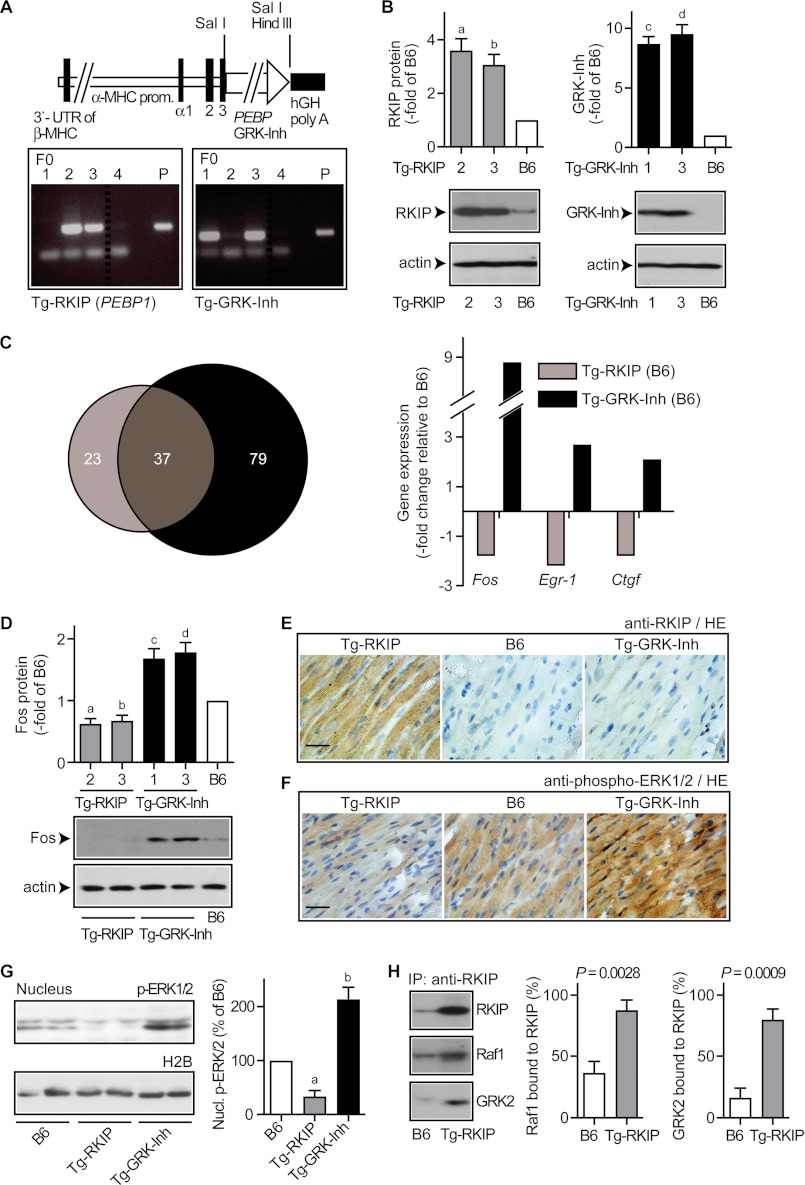
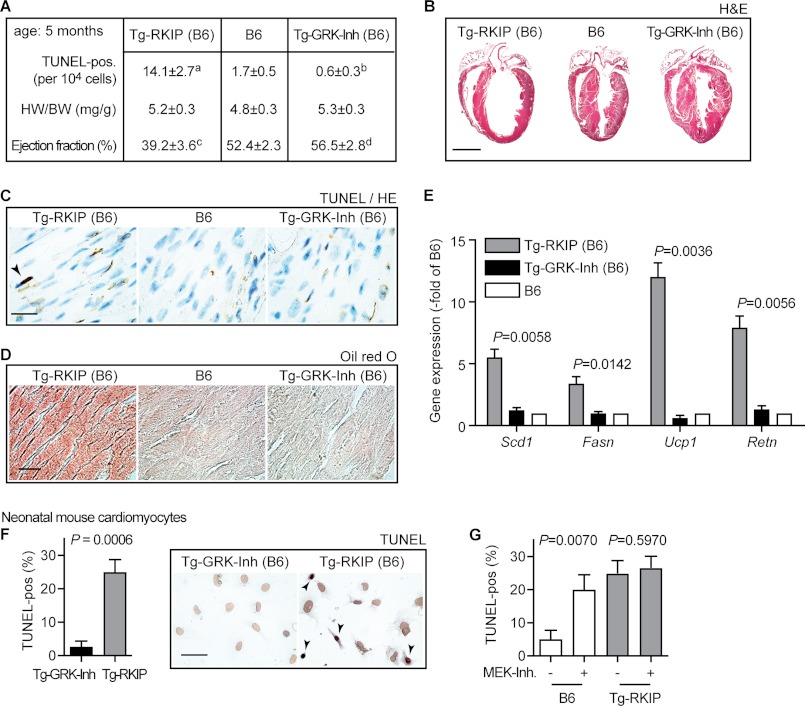
Inhibition of G-protein-coupled receptor kinase 2 (GRK2) is an emerging treatment option for heart failure. Because GRK2 is also indispensable for growth and development, we analyzed the impact of GRK2 inhibition on cell growth and proliferation. Inhibition of GRK2 by the dominant-negative GRK2-K220R did not affect the proliferation of cultured cells. In contrast, upon xenograft transplantation of cells into immunodeficient mice, the dominant-negative GRK2-K220R or a GRK2-specific peptide inhibitor increased tumor mass. The enhanced tumor growth upon GRK2 inhibition was attributed to the growth-promoting MAPK pathway because dual inhibition of the GRK2 and RAF-MAPK axis by the Raf kinase inhibitor protein (RKIP) did not increase tumor mass. The MAPK cascade contributed to the cardioprotective profile of GRK2 inhibition by preventing cardiomyocyte death, whereas dual inhibition of RAF/MAPK and GRK2 by RKIP induced cardiomyocyte apoptosis, cardiac dysfunction, and signs of heart failure. Thus, cardioprotective signaling induced by GRK2 inhibition is overlapping with tumor growth promotion.


Figures

FIGURE 1.
FIGURE 1.
Kinase-dependent and kinase-independent activity of GRK2 in cultured HEK cells. A, immunoblot (IB) detection of HA-GRK2 in cultured HEK control cells (Cont., lane 1), and cells expressing HA-GRK2 (GRK2, lane 2) or HA-GRK2-K220R (K220R, lane 3). The lower panel is a control immunoblot detecting β-actin. B, expression of comparable levels of a GRK2-specific kinase inhibitor (GRK-Inh; MAKFERLQTVTNYFITSE) partially reversed the GRK2-mediated desensitization of a bradykinin B2R-stimulated calcium signal in GRK2-expressing cells (left panel), whereas GRK2-K220R-expressing cells were not affected (right panel). Bars represent mean ± S.E., n = 5.
FIGURE 2.
FIGURE 2.
GRK2-K220R acts as a dominant-negative mutant in HEK cells. A, immunoblot detection (IB: anti-GRK2) of the endogenously expressed GRK2 protein of HEK cells transfected with siRNA control plasmid (siCont., lane 1) or siGRK2 plasmid targeting GRK2 by RNA interference (siGRK2, lane 2). The loading control detected β-actin (lower panel). B and C, GRK2-K220R inhibited the GRK2-mediated interaction of bradykinin-stimulated B2R-Cerulean with β-arrestin1-EYFP. The interaction of B2R-Cerulean with β-arrestin1-EYFP was determined by confocal FRET imaging in the absence or presence of bradykinin (±Bk, 1 μm, 8 min) with control HEK cells (B, left panel), and HEK cells expressing GRK2-K220R (B, middle panel; C, upper panels) or GRK2 (B, right panel; C, lower panels). FRET efficiency was determined by acceptor photobleaching. Data represent mean ± S.E. (B, left panel: n = 3; middle, right panel, n = 9); bar, 10 μm.
FIGURE 3.
FIGURE 3.
Dominant-negative GRK2-K220R enhanced the growth of NOD.Scid mouse-expanded HEK clones. A, cell proliferation of in vitro cultured control HEK cells (Cont.), and HEK cells expressing GRK2 (GRK2) or GRK2-K220R (K220R). The left panel presents cell counts of day 4, and the right panel shows growth curves. Data represent mean (±S.D.) of three independent experiments performed in triplicates. B, left panel: mass of HEK clones after expansion in NOD.Scid mice (± S.D., n = 5). The right panel shows a representative experiment (bar, 5 mm). C, immunoblot detection of GRK2 (IB: anti-GRK2) in lysates of the indicated NOD.Scid mouse-expanded HEK clones (upper panel). The lower panel shows a control blot detecting β-actin. D, immunohistological detection of GRK2 with GRK2-specific antibodies (anti-GRK2) in sections of a NOD.Scid mouse-expanded control HEK clone (Cont.), and HEK clones with overexpression of GRK2 (GRK2) or GRK2-K220R (K220R), respectively. The preabsorption control is a GRK2-K220R-expressing clone. Cell nuclei were stained with hematoxylin (HE), bar, 50 μm. E, immunoblot detection (IB) of phospho-ERK1/2 in total cell lysates of NOD.Scid mouse-expanded HEK clones (as indicated) with phospho-ERK1/2-specific antibodies. The left panel shows a representative immunoblot and the middle panel presents quantitative immunoblot evaluation by densitometric scanning of three different experiments. Bars represent mean ± S.D., n = 3. Right panel, total ERK1/2 protein levels were comparable between control, GRK2- and GRK2-K220R-expressing clones, respectively, as determined by immunoblotting (anti-ERK1/2). All results are representative of 2–3 different HEK cell clones each.
FIGURE 4.
FIGURE 4.
Microarray gene expression profiling revealed up-regulation of MAPK pathway genes in NOD.Scid mouse-expanded HEK clones expressing GRK2-K220R. Microarray gene expression profiling was performed with HEK clones expanded in vivo in NOD.Scid mice (Scid, left panels), of the respective in vitro-cultured HEK cell clones (HEK, middle panels), and of re-cultured cells after NOD.Scid mouse expansion (Ex-Scid, right panels). Gene expression data from GRK2-expressing (GRK-1 and GRK-2) and GRK2-K220R-expressing HEK clones (K220R-1 and K220R-2) are shown. Microarray probe sets were selected according to the following criteria: (i) significant difference (p ≤ 0.01) between NOD.Scid mouse-expanded clones expressing GRK2-K220R (Scid-K220R-1; Scid-K220R-2) and GRK2 (Scid-GRK-1; Scid-GRK-2), (ii) >1.6-fold up-regulation in GRK2-K220R-expressing clones relative to GRK2-expressing clones, and (iii) involvement in the MAPK pathway according to gene ontology analysis. Probe sets with significant differences (K220R- relative to GRK2-expressing HEK cells/clones) are marked in bold. The following genes were identified: FOS, v-fos FBJ murine osteosarcoma viral oncogene homolog; KLF2, Kruppel-like factor 2; S100A6, S100 calcium-binding protein A6, calcyclin; TRIB1, tribbles homolog 1; DCBLD2, discoidin, CUB and LCCL domain containing 2; CRYAB, crystallin, αB; PDGFB, platelet-derived growth factor β polypeptide; EGR1, early growth response 1; DUSP1, dual specificity phosphatase-1. Signal intensities of probe sets detecting the TGFβ target fibronectin (FN) were significantly lower in all GRK2-expressing HEK cells/clones indicative of TGFβ-antagonistic activity of GRK2. Selected data of two gene chips are presented for each group (two different clones/cell preparations per gene chip). The probe set detecting GAPDH is shown as a control.
FIGURE 5.
FIGURE 5.
Dominant-negative GRK2-K220R triggered the nuclear MAPK pathway of NOD.Scid mouse-expanded HEK clones. A, microarray gene expression data of HEK clones after in vivo expansion in NOD.Scid mice (left panel), of cultured HEK cells (middle panel), and re-cultured cells after NOD.Scid mouse expansion (right panel) are presented as a heat map centered around the median value. Data filtering applied the following criteria: (i) significant difference (*, p ≤ 0.01) between NOD.Scid mouse-expanded HEK clones expressing GRK2-K220R and GRK2, (ii) >1.6-fold up-regulation in GRK2-K220R-expressing clones relative to GRK2-expressing clones, and (iii) involvement in the MAPK pathway according to gene ontology analysis. Signal intensities of probe sets detecting the TGFβ target fibronectin (FN) were significantly lower in all GRK2-expressing HEK clones/cells reflecting intact TGFβ-antagonistic activity of GRK2. The probe set of GAPDH is shown as control. B, left panel, real-time qRT-PCR showed up-regulated FOS expression of GRK2-K220R-expressing HEK clones expanded in NOD.Scid mice. Middle and right panels, real-time qRT-PCR analysis revealed low FOS expression of cultured HEK cells (middle panel) and cells re-cultured after in vivo expansion in NOD.Scid mice (right panel). Expression data were normalized to β-actin (FOS/actin) and represent mean ± S.D., n = 3. C, detection of phospho-ERK1/2 by immunohistology with phospho-ERK1/2-specific antibodies in sections of a NOD.Scid mouse-expanded control HEK clone (Cont.), and HEK clones expressing GRK2 (GRK2) or GRK2-K220R (K220R). Nuclei were stained with hematoxylin (HE); bar, 50 μm. D, nuclear phospho-ERK1/2 levels of NOD.Scid mouse-expanded HEK clones without (Cont., set to 100%) or with expression of GRK2 or GRK2-K220R (all samples were normalized to histone H2B). Data are mean ± S.D., n = 3. The right panels show a representative immunoblot experiment. E, increased interaction of β-arrestin with GRK2-K220R compared with GRK2 as determined by immunoenrichment of GRK2 (IP) from GRK2-expressing or GRK2-K220R-expressing HEK clones, respectively, followed by immunoblot (IB) detection of co-enriched β-arrestin and enriched GRK2. Bars represent mean ± S.D., n = 3. The right panels show a representative experiment (middle and lower panels) and a control immunoblot detecting β-arrestin (upper panel). All results are representative of 2–3 different HEK cell clones each.
FIGURE 6.
FIGURE 6.
Trophic effects of MEF feeder cells reconstituted GRK2-dependent growth control in vitro. A, cell proliferation analysis of HEK cells plated on mitomycin-inactivated MEF feeder cells showed decreased cell proliferation of GRK2-expressing HEK cells compared with HEK control cells and enhanced cell proliferation of dominant-negative GRK2-K220R-expressing cells. As indicated, EGF-supplemented cells were treated without or with the MEK inhibitor PD0325901. Cell proliferation is expressed as percentage of control, i.e. MEK inhibitor-treated control cells (set to 100%). Bars represent mean ± S.D., n = 3 (a, p = 0.0022; and b, p = 0.0018 versus Cont. without MEK inhibitor; c, p = 0.1515; and d, p = 0.1029 versus Cont. with MEK inhibitor). B, nuclear phospho-ERK1/2 levels of HEK cells plated on mitomycin-inactivated MEF feeder cells. The left and middle panels show a representative experiment and the right panel presents the quantitative evaluation of three different experiments without MEK inhibitor (± S.D., n = 3; a, p = 0.0113, and b, p = 0.0312 versus Cont.).
FIGURE 7.
FIGURE 7.
The RAF-MAPK pathway triggered by GRK2 inhibition promotes tumor growth. A, left panel, immunoblot (IB) detection of GRK2 with GRK2-specific antibodies (anti-GRK2) in lysates of a NOD.Scid mouse-expanded control A431 tumor (Cont., lane 1), and A431 tumors expressing GRK2 (lane 2) or GRK2-K220R (lane 3). The loading control detected β-actin (lower panel). Right panel, expression level of the GRK2-specific peptide inhibitor (GRK-Inh, MAKFERLQTVTNYFITSE) in NOD.Scid mouse expanded A431 tumors was determined by real-time qRT-PCR relative to mock-transfected A431 control tumors (Cont.). Bars represent mean ± S.D., n = 4. B, left panel, nuclear phospho-ERK1/2 levels of NOD.Scid mouse expanded A431 tumors without (Cont., set to 100%) or with expression of GRK2 (GRK2), GRK2-K220R (K220R), the GRK2-specific peptide inhibitor (GRK-Inh) and RKIP (RKIP), respectively (all samples were normalized to histone H2B). Data represent mean ± S.D., n = 3 (a, p = 0.0150; b, p = 0.0087; c, p = 0.0067; d, p = 0.1537 versus Cont). The right panels show a representative immunoblot experiment. C, detection of phospho-ERK1/2 by immunohistology with phospho-ERK1/2-specific antibodies in a NOD.Scid mouse expanded control A431 tumor (Cont.), and A431 tumors expressing GRK2, GRK2-K220R (K220R), the GRK2-specific peptide inhibitor (GRK-Inh), or RKIP. Nuclei were stained with hematoxylin (HE); bar, 20 μm. D, real-time qRT-PCR analysis of FOS expression of different NOD.Scid mouse expanded A431 tumors without (Cont.) or with expression of GRK2, GRK2-K220R (K220R), the GRK2-specific peptide inhibitor (GRK-Inh), and RKIP. Data represent mean ± S.D. (n = 3). E, tumor mass of NOD.Scid mouse expanded A431 tumors without (Cont.) or with expression of GRK2 or the dominant-negative GRK2-K220R. Data represent mean ± S.D.; n = 5 (a, p = 0.0029; b, p = 0.0001 versus Cont.); bar, 5 mm. F, GRK2 inhibition by the GRK2-specific peptide inhibitor (GRK-Inh) promoted A431 tumor growth, whereas dual inhibition of the GRK2 and RAF-MAPK axis by RKIP did not. Data represent mean ± S.D.; n = 5 (a, p = 0.5439; b, p = 0.0014 versus Cont.); bar, 5 mm. G, the expression of RKIP was determined by real-time qRT-PCR in NOD.Scid mouse expanded A431 tumors expressing RKIP relative to A431 control tumors (Cont.). Bars represent mean ± S.D. (n = 4). H, overexpressed RKIP scavenged the cellular RAF1 and GRK2 pools. Enrichment of RKIP was performed with RKIP-specific antibodies (IP, anti-RKIP) from control A431 tumors (Cont.) and RKIP-expressing A431 tumors (RKIP) followed by immunoblot detection of enriched RKIP (upper panel), co-enriched RAF1 (middle panel) or co-enriched GRK2 (lower panel). The left panel shows a representative experiment and middle and right panels present quantitative evaluation of three different experiments (mean ± S.D.; n = 3). RKIP-bound RAF1 is expressed as % of total RAF1 (set to 100%) and RKIP-bound GRK2 is expressed as % of total GRK2 (set to 100%). Total RAF1 and total GRK2 protein was determined by quantitative immunoblotting. I, tumor mass of RKIP-expressing and GRK-Inh-expressing A431 tumors, respectively, expanded in NOD.Scid mice treated without or with the MEK inhibitor PD0325901 (20 mg/kg/day). Data represent mean ± S.D., n = 3. J, GRK-Inh expression (+GRK-Inh) did not significantly increase the nuclear phospho-ERK1/2 level of A431 tumors with down-regulated GRK2 (+siGRK2). Nuclear phospho-ERK1/2 is expressed as percentage of control, i.e. siGRK2-expressing A431 tumors without GRK-Inh (set to 100%). GRK2 down-regulation by siGRK2 was controlled by immunoblotting. Data represent mean ± S.D., n = 3. K, expression analysis of the GRK2-regulated TGFβ target, fibronectin (FN) was performed by real-time qRT-PCR with the NOD.Scid mouse expanded A431 clones used in D. Data represent mean ± S.D. (n = 3). All results are representative of 2–5 different A431 cell clones each.
FIGURE 8.
FIGURE 8.
Enrichment of GRK2 by GRK2-specific peptide inhibitor immunoaffinity chromatography and identification by nano-LC-ESI-MS/MS. A, proteins were enriched from GRK-Inh-expressing tumors by immunoaffinity chromatography with antibodies specific for GRK-Inh. The left panel shows a silver-stained gel of proteins enriched by immunoaffinity purification with GRK2-inhibitor-specific antibodies (AP:GRK-Inh; lane 1) compared with a control column (AP:Cont., lane 2). The right panel shows the immunoblot (IB) detection of GRK2 in the specific eluate (lane 1) compared with the control eluate (lane 2). B, after immunoaffinity chromatography with GRK-Inh-specific antibodies (AP:GRK-Inh), the GRK2-reactive band was cut and subjected to nano-LC-ESI-MS/MS. With 27 matching peptides, the Mascot search engine identified the human β-adrenergic receptor kinase 1 (GRK2) with the highest probability score. Regions of identified peptides matching with the human β-adrenergic receptor kinase 1 (GRK2) protein sequence are marked.
FIGURE 9.
FIGURE 9.
MAPK pathway activation in transgenic mice with systemic expression of the GRK2-specific peptide inhibitor. A, left, generation of transgenic mouse lines (Tg1 and Tg2) with expression of the GRK2-specific peptide inhibitor under control of the CMV immediate-early promoter/enhancer (upper panel, left, diagram of the transgene; lower panel, left, identification of transgenic lines with integration of Tg-CMV-GRK-Inh into the mouse genome). The right panels present immunoblot detection of the GRK2-specific peptide inhibitor in different organs isolated from Tg-CMV-GRK-Inh-transgenic mice. B, immunoblot detection showed increased Fos protein levels in different organs from transgenic mice with systemic GRK2-specific peptide inhibitor expression under control of the CMV promoter (Tg-GRK-Inh) compared with B6 mice. The lower panels present control blots detecting β-actin. Bars represent mean ± S.D., n = 3 mice/group. C and D, nuclear (C) and cytosolic (D) phospho-ERK1/2 protein levels were determined by immunoblot analysis of different organs from transgenic mice with GRK2-specific peptide inhibitor expression under control of the CMV promoter. Nuclear proteins were normalized to H2B (C). Total cytosolic ERK1/2 protein was comparable between Tg-GRK-Inh mice and non-transgenic B6 mice (D). Bars represent mean ± S.D., n = 3 mice/group. E, stabilization of activated phospho-ERK1/2 by kinase-inhibited GRK2 (inhibited by GRK-Inh) or kinase-deficient GRK2-K220R. GRK2 protein was enriched by immunoaffinity purification (AP: GRK2) from A431 control tumors (Cont.) or A431 tumors expressing the GRK2-specific peptide inhibitor (GRK-Inh, left panel), and from GRK2-expressing or GRK2-K220R-expressing A431 tumors (right panel). Enriched GRK2 (IB: GRK2) and co-enriched phospho-ERK1/2 (IB: p-ERK1/2) were detected in the immunoblot. Quantitative assessment of co-enriched phospho-ERK1/2 was performed and is presented as percentage of the control A431 tumor (left panel) or the GRK2-expressing A431 tumor (right panel). Bars represent mean ± S.D., n = 3. F, immunoaffinity enrichment of GRK2 (AP: GRK2) from different organs isolated from transgenic mice with systemic GRK2-specific peptide inhibitor expression (Tg-GRK-Inh) or from non-transgenic B6 mice followed by immunoblot detection of enriched GRK2 (IB: GRK2) and co-enriched phospho-ERK1/2 (IB: p-ERK1/2). Quantitative assessment of co-enriched phospho-ERK1/2 is presented as percentage of B6 (±S.D., n = 3 mice/group).
FIGURE 10.
FIGURE 10.
GRK2 inhibition induced MAPK signaling in hearts of transgenic mice. A, diagram of the α-myosin heavy chain (MHC) plasmid used for the generation of transgenic mice with myocardium-specific RKIP or GRK2-specific peptide inhibitor (GRK-Inh) expression. Lower panels show the identification of founder mice (F0) with stable integration of the respective plasmid (P) encoding the RKIP transgene (left) or the GRK-Inh transgene (right) into genomic DNA. B, immunoblot analysis revealed increased RKIP protein in cardiac tissue of transgenic Tg-RKIP mice (left), and the GRK-specific peptide inhibitor was detected in cardiac tissue of transgenic Tg-GRK-Inh mice (right). Bars represent mean ± S.D., n = 3 mice/group (a, p = 0.0102; b, p = 0.0125; c, p = 0.0028; d, p = 0.0035 versus B6, set to 1), and lower panels show representative immunoblots. C, microarray gene expression profiling identified significantly regulated probe sets (p ≤ 0.01, fold-change relative to B6 mice ≥2 or ≤ −2, and signal intensity ≥100) in hearts of 2-month-old Tg-RKIP and Tg-GRK-Inh mice, respectively, relative to age-matched non-transgenic B6 control mice. The Venn diagram (left) illustrates the number of significantly regulated probe sets for each model. Thirty-seven probe sets (i.e. 61.7%) of Tg-RKIP hearts showed concordant regulation with Tg-GRK-Inh mice. Right panel, data filtering identified probe sets with significant up-regulation in Tg-GRK-Inh hearts (≥2-fold over the B6 control; p ≤ 0.01), and reduced expression in Tg-RKIP hearts relative to B6. D, the Fos protein was increased in Tg-GRK-Inh hearts relative to B6 controls, whereas Fos was decreased in Tg-RKIP hearts. Bars represent mean ± S.D., n = 3 mice/group (a, p = 0.0184; b, p = 0.0284; c, p = 0.0179; d, p = 0.0137 versus B6, set to 1), and lower panels show representative immunoblots. E, immunohistology detection revealed a high RKIP protein level in a heart section of a Tg-RKIP mouse relative to an age-matched B6 control mouse or a GRK2-specific peptide inhibitor-expressing mouse (Tg-GRK-Inh). Nuclei were stained with hematoxylin (HE), bar, 40 μm. F, immunohistology detection of phospho-ERK1/2 in heart sections of Tg-RKIP, B6 control, and Tg-GRK-Inh mice (bar, 40 μm). Histology data are representative of three different mice each (E and F). G, increased nuclear phospho-ERK1/2 level of transgenic hearts with GRK2-specific peptide inhibitor expression. The left panels show a representative immunoblot experiment, and the right panel presents quantitative data (±S.D., n = 3 mice/group; a, p = 0.0099; b, p = 0.0132; versus B6, set to 100%). H, transgenic RKIP scavenged the cardiac Raf1 and GRK2 protein pools as determined by immunoenrichment of RKIP with RKIP-specific antibodies (IP: RKIP) from B6 hearts (B6) and RKIP-transgenic hearts (Tg-RKIP) followed by immunoblot detection of enriched RKIP (upper panel), co-enriched Raf1 (middle panel), and co-enriched GRK2 (lower panel). The left panels show a representative experiment and the middle and right panels represent quantitative evaluation of three different experiments. Raf1 bound to RKIP is expressed as % of total Raf1, and GRK2 bound to RKIP is expressed as % of total GRK2 (±S.D., n = 3).
FIGURE 11.
FIGURE 11.
Concordant regulation of gene expression by RKIP and the GRK2-specific peptide inhibitor in hearts of transgenic mice. Whole genome microarray gene expression profiling of heart tissue from 2-month-old mice identified probe sets of RKIP-transgenic hearts (Tg-RKIP) and GRK-Inh-transgenic hearts (Tg-GRK-Inh) with concordant up-regulation (upper panel) or down-regulation (lower panel) compared with B6 control mice (fold-change relative to B6: ≥2 or ≤ −2, and p ≤ 0.01). Bars represent mean of two different gene chips (three mice/gene chip). All data were normalized to β-actin.
FIGURE 12.
FIGURE 12.
Inhibition of the MAPK pathway by transgenic RKIP overexpression triggered signs of heart failure in B6 mice. A, quantitative assessment of TUNEL-positive nuclei, determination of heart weight to body weight ratio (HW/BW, mg/g), and measurement of left ventricular ejection fraction (%) by transthoracic echocardiography of Tg-RKIP, B6 control, and Tg-GRK-Inh mice (age: 5 months). Data represent mean ± S.D., n = 5 mice/group (a, p = 0.0001; b, p = 0.0018; c, p = 0.0001; d, p = 0.0352 versus B6). B, representative hematoxylin-eosin (H&E)-stained heart sections of 5-month-old Tg-RKIP, B6, and Tg-GRK-Inh mice (bar, 2 mm). C, TUNEL staining of heart sections from Tg-RKIP, B6 control, and Tg-GRK-Inh mice (bar, 20 μm). D, 5-month-old mice with myocardium-specific RKIP overexpression showed cardiac lipid overload as detected by Oil Red O staining (bar, 40 μm). E, gene expression analysis by real-time qRT-PCR detected increased expression of lipid metabolism genes (Scd1, Fasn, Ucp1, Retn) in hearts of 5-month-old RKIP-transgenic mice (all samples were normalized to Gapdh). Bars represent mean ± S.D. (n = 3). p values of significantly different gene expression data (versus B6) are indicated. F, quantitative assessment of TUNEL-positive nuclei of neonatal mouse cardiomyocytes isolated from transgenic hearts with GRK2-specific peptide inhibitor expression (Tg-GRK-Inh) or from RKIP-transgenic hearts. The left panel shows the percentage of TUNEL-positive cardiomyocytes (±S.D., n = 3), and the middle and right panels show representative images. G, treatment of neonatal mouse cardiomyocytes with the MEK-specific inhibitor PD0325901 (MEK-Inh) increased the number of TUNEL-positive neonatal mouse cardiomyocytes from B6 mice, whereas RKIP-transgenic cardiomyocytes were not substantially affected (±S.D., n = 3). Histology experiments are representative of three different mice each (B–D).
FIGURE 13.
FIGURE 13.
Inhibition of GRK2 in transgenic FVB mice. A, quantitative assessment of TUNEL-positive nuclei, determination of heart weight to body weight ratio (HW/BW, mg/g), and measurement of left ventricular ejection fraction (%) by transthoracic echocardiography of FVB mice with myocardium-specific RKIP expression, and non-transgenic FVB control mice (age: 10 weeks). Data represent mean ± S.D., n = 5 mice/group (a, p = 0.0001; b, p = 0.0004; c, p < 0.0001). B, representative hematoxylin-eosin (H&E)-stained heart sections of a 10-week-old FVB mouse with transgenic RKIP expression (Tg-RKIP, FVB) and a non-transgenic FVB control mouse show cardiac hypertrophy with dilatation of the RKIP-transgenic FVB mouse (bar, 1.8 mm). C, increased cardiac RKIP protein levels of two different FVB mouse lines with myocardium-specific RKIP expression (±S.D., n = 5 mice/group; a, p = 0.0025; b, p = 0.0003 versus FVB). D, cardiac GRK2-specific peptide inhibitor detection in FVB mice with transgenic GRK-Inh expression (±S.D., n = 5 mice/group; a, p = 0.0031; b, p = 0.0004 versus FVB). E, representative hematoxylin-eosin (H&E)-stained heart sections of 4-month-old FVB mice with transgenic GRK2-specific peptide inhibitor expression (Tg-GRK-Inh, FVB; left panel) and non-transgenic FVB control mice (right panel) without (Sham) or with 4 weeks of AAC (bar, 1.8 mm). F, determination of heart weight to body weight ratio (HW/BW) and left ventricular ejection fraction (%) by transthoracic echocardiography of Tg-GRK-Inh (FVB) mice and non-transgenic FVB mice without (Sham) and with pressure overload imposed by 4 weeks of AAC. Data represent mean ± S.D., n = 4 mice/group (a, p = 0.0201 versus Sham-Tg-GRK-Inh; b, p = 0.0033 versus AAC-FVB; c, p = 0.0002 versus Sham FVB; d, p = 0.0001 versus Sham-Tg-GRK-Inh; e, p = 0.0004 versus AAC-FVB; f, p < 0.0001 versus Sham FVB). Histology experiments are representative of three different mice each (B and E).

Similar articles

Cited by

References

    1. Gurevich E. V., Tesmer J. J., Mushegian A., Gurevich V. V. (2012) G protein-coupled receptor kinases. More than just kinases and not only for GPCRs. Pharmacol. Ther. 133, 40–69 - PMC - PubMed
    1. Philipp M., Fralish G. B., Meloni A. R., Chen W., MacInnes A. W., Barak L. S., Caron M. G. (2008) Smoothened signaling in vertebrates is facilitated by a G protein-coupled receptor kinase. Mol. Biol. Cell 19, 5478–5489 - PMC - PubMed
    1. Jiang X., Yang P., Ma L. (2009) Kinase activity-independent regulation of cyclin pathway by GRK2 is essential for zebrafish early development. Proc. Natl. Acad. Sci. U.S.A. 106, 10183–10188 - PMC - PubMed
    1. Jaber M., Koch W. J., Rockman H., Smith B., Bond R. A., Sulik K. K., Ross J., Jr., Lefkowitz R. J., Caron M. G., Giros B. (1996) Essential role of β-adrenergic receptor kinase 1 in cardiac development and function. Proc. Natl. Acad. Sci. U.S.A. 93, 12974–12979 - PMC - PubMed
    1. Gros R., Benovic J. L., Tan C. M., Feldman R. D. (1997) G-protein-coupled receptor kinase activity is increased in hypertension. J. Clin. Invest. 99, 2087–2093 - PMC - PubMed

Publication types

MeSH terms

Substances

Associated data