. 2013 Mar 22;288(12):8544-8559.
doi: 10.1074/jbc.M112.411629. Epub 2013 Jan 28.

Cyr61, a matricellular protein, is needed for dendritic arborization of hippocampal neurons

Affiliations

Cyr61, a matricellular protein, is needed for dendritic arborization of hippocampal neurons

Anna R Malik et al. J Biol Chem. .

Abstract

The shape of the dendritic arbor is one of the criteria of neuron classification and reflects functional specialization of particular classes of neurons. The development of a proper dendritic branching pattern strongly relies on interactions between the extracellular environment and intracellular processes responsible for dendrite growth and stability. We previously showed that mammalian target of rapamycin (mTOR) kinase is crucial for this process. In this work, we performed a screen for modifiers of dendritic growth in hippocampal neurons, the expression of which is potentially regulated by mTOR. As a result, we identified Cyr61, an angiogenic factor with unknown neuronal function, as a novel regulator of dendritic growth, which controls dendritic growth in a β1-integrin-dependent manner.


Figures
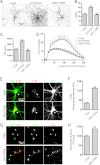
FIGURE 1.
FIGURE 1.
Expression of constitutively active S6K1 is not sufficient to induce dendritogenesis. A, representative images of cultured in vitro hippocampal neurons transfected on DIV8 for 7 days with plasmids that encode β-gal, p110CAAX or S6K1T389E. The cells were cotransfected with a GFP-coding vector for the visualization of neuronal morphology. Scale bar, 50 μm. Shown are TNDT (B), TDL (C), and Sholl analysis (D) of cells transfected as described in A (β-gal, n = 45; p110CAAX, n = 41; S6K1T389E, n = 45). Cell images were obtained from three independent culture batches. Error bars, S.E. ***, p < 0.001, compared with β-gal (Kruskal-Wallis test followed by Dunn's post hoc test for B and C; two-way ANOVA test followed by Bonferroni's post hoc test for D); ns, not significant. E, representative images of cultured in vitro hippocampal neurons transfected on DIV8 for 3 days with vectors that encode either β-gal or S6K1T389E and immunostained for P-S6 (Ser-235/236). GFP-encoding plasmid was cotransfected for the visualization of transfected cells. Scale bar, 25 μm. F, quantification of P-S6 immunofluorescence (β-gal, n = 60; S6K1T389E, n = 57). Cell images were obtained from three independent culture batches. Error bars, S.E. ***, p < 0.001 (Mann-Whitney test). AU, arbitrary units. G, representative images of hippocampal neurons cultured in vitro and transfected on DIV0 for 3 days with plasmids that encode either β-gal or S6K1T389E together with one that encodes GFP (green) and immunofluorescently labeled with anti-Tau1 antibody to highlight axons (red). The arrowheads point to Tau1-positive neurites. Scale bar, 50 μm. H, mean length of axons, classified based on morphological criteria, expressed as a percentage of the mean value for β-gal-transfected control neurons (β-gal, n = 67; S6K1T389E, n = 69). Cell images were obtained from three independent culture batches (different from G). Error bars, S.E. ***, p < 0.001 (Mann-Whitney test).
FIGURE 2.
FIGURE 2.
shRNA screening results indicate that Cyr61 is a possible mTOR effector involved in dendritogenesis. Shown are the results of screening for possible mTOR effectors involved in dendritogenesis. Hippocampal neurons cultured in vitro were transfected on DIV8 for 4 days with pSuper vectors that encode pools of two or three shRNAs that target mRNAs possibly regulated by mTOR at the level of transcription. A GFP-encoding plasmid was cotransfected for the visualization of transfected neurons. As controls, empty pSuper or pSuper-mTOR7513 (encoding mTORsh) was transfected to neurons on each culture plate. The plot represents the mean TNDT ± S.E. (error bars) obtained in two independent experiments, expressed as a percentage of a corresponding pSuper-transfected negative control from the same culture plate.
FIGURE 3.
FIGURE 3.
Cyr61 is expressed in cultured hippocampal neurons and rat hippocampus and can be induced by insulin and BDNF treatment. cyr61 expression was assessed by RT-qPCR and quantified relative to GAPDH. A, cyr61 expression in cultured hippocampal neurons on the indicated days in vitro. The plot represents the 2(−ΔΔCt) mean values ± S.E. (error bars) (DIV7, n = 4; DIV10, n = 4; DIV14, n = 3; DIV17, n = 4). **, p < 0.01; *, p < 0.05; ns, not significant (one-way ANOVA test followed by Tukey's multiple comparison test). B, cyr61 expression in rat hippocampi from animals on the indicated embryonic (E) or postnatal (P) days. The plot represents 2(−ΔΔCt) mean values ± S.E. (n = 3 for each experimental group). ***, p < 0.01; ns, not significant (one-way ANOVA test followed by Tukey's multiple comparison test). C, D, F, and G, hippocampal neurons cultured in vitro (DIV8) were incubated overnight in medium with reduced B27 and stimulated with insulin or BDNF for 1 h. DMSO (control), actinomycin D, UO-126, or wortmannin was added to the medium 45 min prior to stimulation. Cyr61 expression in single experiments was compared with controls treated with DMSO. The plots represent mean values ± S.E. from six independent experiments. ***, p < 0.001; *, p < 0.05; ns, not significant compared with control value = 1 (one-sample t test). ###, p < 0.001; ##, p < 0.01; #, p < 0.05; ns, not significant compared as indicated (paired t test). E, hippocampal neurons cultured in vitro (DIV21) were incubated for 4 h in a medium without B27 and stimulated with bicuculline, insulin, or BDNF for 1 h. Cyr61 expression in single experiments was compared with untreated controls. The plot represents mean values ± S.E. from four independent experiments. ***, p < 0.001 compared with control value = 1 (one-sample t test).
FIGURE 4.
FIGURE 4.
Knockdown of Cyr61 in developing neurons simplifies dendritic tree morphology. A, Cyr61shRNA validation was performed after nucleofection of RAT2 cells with pSuper, Cyr61sh#1, -sh#2, or -sh#3 or a pool of shRNAs. The cells were lysed 2 days after nucleofection, and Cyr61 mRNA levels were assessed by RT-qPCR, quantified relative to GAPDH, and compared with pSuper-nucleofected controls. The plot represents the mean values ± S.E. (error bars) from four independent experiments. **, p < 0.01; *, p < 0.05, compared with control value = 1 (one-sample t test); ns, not significant. B, representative images of cultured in vitro rat hippocampal neurons transfected on DIV8 for 4 days with pSuper vector (control) or plasmids that encode individual Cyr61sh or their pool (Cyr61sh-mix). The GFP-encoding plasmid was cotransfected for the visualization of transfected cells. Scale bar, 50 μm. C, TNDT of neurons transfected as described in B. Cell images were obtained from three independent culture batches. The data are expressed as mean values ± S.E. (pSuper, n = 53; Cyr61sh-mix, n = 58; Cyr61sh#1, n = 51; Cyr61sh#2, n = 42; Cyr61sh#3, n = 47). ***, p < 0.001, compared with pSuper (Kruskal-Wallis test followed by Dunn's post hoc test). D, TNDT of neurons transfected with either pSuper or scrambled shRNA vector and GFP-encoding plasmid as described in B. Cell images were obtained from three independent culture batches (pSuper, n = 54; Cyr61scr#1, n = 55; Cyr61scr#2, n = 45; Cyr61scr#3, n = 51). The data are expressed as mean values ± S.E. ns, not significant (compared with pSuper; Kruskal-Wallis test followed by Dunn's post hoc test). Shown are TDL (mean values ± S.E.) (E) and Sholl analysis (F) of neurons transfected as described in B (cell numbers as in C). ***, p < 0.001, compared with pSuper (Kruskal-Wallis test followed by Dunn's post hoc test; see supplemental Table 3 for detailed statistics for F).
FIGURE 5.
FIGURE 5.
Effect of Cyr61sh on TNDT is specific and can be rescued by overexpressing Cyr61-GFP. A, schematic representation of Cyr61 mRNA and Cyr61-GFP coding sequence and localization of sequences targeted by Cyr61shRNAs. Note that Cyr61sh#1 and Cyr61sh#2 target both mRNA and the Cyr61-GFP coding sequence, whereas Cyr61sh#3 recognizes the sequence in the 3′-UTR of mRNA, absent in Cyr61-GFP. B, representative images of hippocampal neurons transfected on DIV8 with β-actin-Cyr61-GFP together with Cyr61sh#1, -sh#2, or -sh#3 or an empty pSuper vector and fixed after 4 days. mRFP-encoding plasmid was cotransfected to visualize transfected cells. Scale bar, 20 μm. C, representative images of rat hippocampal neurons cultured in vitro transfected on DIV8 for 4 days with either pSuper or pSuper-Cyr61sh#3 together with β-actin-GFP or β-actin-Cyr61-GFP. mRFP-encoding plasmid was cotransfected to visualize the morphology of transfected cells. Scale bar, 50 μm. Shown are TNDT (D), TDL (D), and Sholl analysis (F) of neurons transfected as in C. Cell images were obtained from three independent culture batches (pSuper/GFP, n = 38; pSuper/Cyr61-GFP, n = 37; Cyr61sh#3/GFP, n = 41; Cyr61sh#3/Cyr61-GFP, n = 37). The data are expressed as mean values ± S.E. (error bars). ***, p < 0.001; *, p < 0.05; ns, not significant (Kruskal-Wallis test followed by Dunn's post hoc test for D and E; see supplemental Table 3 for detailed statistics for F).
FIGURE 6.
FIGURE 6.
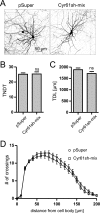
Cyr61 knockdown in mature neurons does not disrupt dendritic tree morphology. A, representative images of rat hippocampal neurons cultured in vitro and transfected on DIV15 for 4 days with pSuper vector (control) or a pool of plasmids that encode Cyr61sh#1, -sh#2, and -sh#3 (Cyr61sh-mix). GFP-encoding plasmid was cotransfected for the visualization of transfected cells. Scale bar, 50 μm. Shown are TNDT (B), TDL (C), and Sholl analysis (D) of neurons transfected as in A. Cell images were obtained from three independent culture batches (pSuper, n = 36; Cyr61sh-mix, n = 32). The data are expressed as mean values ± S.E. (error bars). ns, not significant (Mann-Whitney test for B and C; two-way ANOVA test followed by Bonferroni's post hoc test in D).
FIGURE 7.
FIGURE 7.
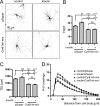
Cyr61 knockdown inhibits dendritic growth induced by insulin. A, representative images of hippocampal neurons cultured in vitro; transfected on DIV8 with pSuper or a pool of Cyr61sh#1, -sh#2, and -sh#3 (Cyr61sh-mix); and cultured under conditions of reduced B27 concentration. GFP was cotransfected for the visualization of transfected neurons. To induce dendritogenesis, insulin was added 4 h after transfection and then every 24 h until cell fixation on DIV12. Scale bar, 50 μm. Shown are TNDT (B), TDL (C), and Sholl analysis (D) of neurons transfected and treated as described in A. Cell images were obtained from three independent culture batches (control/pSuper, n = 60; insulin/pSuper, n = 60; control/Cyr61sh-mix, n = 59; insulin/Cyr61sh-mix, n = 60). The data are expressed as mean values ± S.E. (error bars). ***, p < 0.001; **, p < 0.01; ns, not significant (Kruskal-Wallis test followed by Dunn's post hoc test for B and C; see supplemental Table 3 for detailed statistics for D).
FIGURE 8.
FIGURE 8.
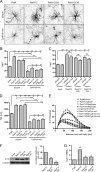
Cyr61 knockdown inhibits dendritic growth induced by constitutively active Ras mutants. A, representative images of hippocampal neurons transfected on DIV8 for 4 days as indicated. GFP-encoding plasmid was cotransfected for the visualization of transfected neurons. Scale bar, 50 μm. B, TNDT of transfected cells. Cell images were obtained from three independent culture batches (pSuper/β-gal, n = 41; pSuper/RasV12, n = 40; pSuper/RasV12S35, n = 37; pSuper/RasV12C40, n = 40; Cyr61sh-mix/β-gal, n = 41; Cyr61sh-mix/RasV12, n = 37; Cyr61sh-mix/RasV12S35, n = 39; Cyr61sh-mix/RasV12C40, n = 36). The data are expressed as mean values ± S.E. (error bars). ***, p < 0.001; **, p < 0.01; ns, not significant (Kruskal-Wallis test followed by Dunn's post hoc test). C, TNDT of hippocampal neurons transfected on DIV8 for 4 days as indicated. Cell images were obtained from three independent culture batches (pSuper/β-gal, n = 39; Cyr61scr-mix/β-gal, n = 38; pSuper/RasV12, n = 38; Cyr61scr-mix/RasV12, n = 37; pSuper/RasV12S35, n = 37; Cyr61scr-mix/RasV12S35, n = 33; pSuper/RasV12C40, n = 38; Cyr61scr-mix/RasV12C40, n = 39). The data are expressed as mean values ± S.E. ***, p < 0.001; *, p < 0.05; ns, not significant (Kruskal-Wallis test followed by Dunn's post hoc test). Shown are TDL (D) and Sholl analysis (E) of neurons transfected as described in A (cell numbers as in C). The data are expressed as mean values ± S.E. ***, p < 0.001; **, p < 0.01; *, p < 0.05; ns, not significant (Kruskal-Wallis test followed by Dunn's post hoc test for D; see supplemental Table 3 for detailed statistics for E). F and G, HA-tagged Ras active mutants (RasV12, RasV12S35, and RasV12C40) were expressed for 2 days in nucleofected cortical neurons. Nucleofection with β-gal-encoding plasmid was used as a control. F, representative results (left) and quantitative analysis of Western blot analysis of HA-tagged Ras mutant expression levels in nucleofected cortical neurons. Tubulin is shown as a loading control (left). The plot (right) represents the mean values ± S.E. of a ratio of HA signal to tubulin signal from five experiments. The HA/tubulin ratio for the RasV12 variant was treated as 1. G, results of RT-qPCR analysis of Cyr61 mRNA levels in cortical neurons nucleofected with either β-gal (control) or Ras mutant-encoding vectors. Cyr61 mRNA levels were quantified relative to GAPDH and compared with controls in each experiment. The plot represents the mean values ± S.E. from five independent experiments. ***, p < 0.001; **, p < 0.01; *, p < 0.05, compared with control value = 1 (one-sample t test); ns, not significant.
FIGURE 9.
FIGURE 9.
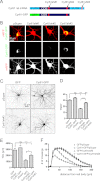
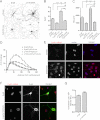
Cyr61 knockdown inhibits dendritic growth induced by active PI3K. A, representative images of hippocampal neurons transfected on DIV8 for 4 days as indicated. GFP-encoding plasmid was cotransfected for the visualization of transfected neurons. Scale bar, 50 μm. Shown are TNDT (B), TDL (C), and Sholl analysis (D) of transfected cells. Cell images were obtained from three independent culture batches (pSuper/β-gal, n = 35; Cyr61sh-mix/β-gal, n = 35; pSuper/p110CAAX, n = 36; Cyr61sh-mix/p110CAAX, n = 35). ***, p < 0.001, compared with pSuper/β-gal (Kruskal-Wallis test followed by Dunn's post hoc test; see supplemental Table 3 for detailed statistics for D). E, representative images of DIV10 hippocampal neurons stained by FISH with sense and antisense riboprobes against Cyr61 mRNA (red) and counterstained with Hoechst 33285 to visualize cell nuclei (blue). F, representative images of hippocampal neurons transfected on DIV8 for 2 days with either β-gal-encoding plasmid alone or plasmids that encode β-gal and p110CAAX, stained by FISH with antisense riboprobe against Cyr61 mRNA (red), and counterstained with β-gal antibody to identify transfected cells (green) and Hoechst 33285 to visualize cell nuclei (blue). G, quantification of mean intensity of FISH signal of cells transfected as in F standardized to mean intensity of FISH signal of neighboring non-transfected cells from the same image. Cell images were obtained from three independent culture batches (β-gal, n = 31; β-gal/p110CAAX, n = 38). The data are expressed as mean values ± S.E. (error bars). ***, p < 0.001, compared with β-gal (Mann-Whitney test).
FIGURE 10.
FIGURE 10.
Cyr61 overexpression induces dendritic tree growth in a β1-integrin-dependent manner. A, representative images of hippocampal neurons transfected on DIV8 for 6 days with GFP or Cyr61-GFP-encoding plasmids. mRFP-encoding plasmid was cotransfected for the visualization of transfected cells. Scale bar, 50 μm. Shown are TNDT (B), TDL (C), and Sholl analysis (D) of neurons transfected as in A. Cell images were obtained from three independent culture batches (GFP, n = 47; Cyr61-GFP, n = 40). E, representative images of hippocampal neurons transfected on DIV15 for 6 days with GFP- or Cyr61-GFP-encoding plasmids. mRFP-encoding plasmid was cotransfected for the visualization of transfected cells. Scale bar, 50 μm. Shown are TNDT (F), TDL (G), and Sholl analysis (H) of neurons transfected as in E. Cell images were obtained from three independent culture batches (GFP, n = 36; Cyr61-GFP, n = 38). The data are expressed as mean values ± S.E. (error bars). ***, p < 0.001; **, p < 0.01; *, p < 0.05, Mann-Whitney test for B, C, F, and G or two-way ANOVA followed by Bonferroni's post hoc test for D and H. I, representative images of hippocampal neurons transfected on DIV8 for 6 days with GFP- or Cyr61-GFP-encoding plasmids. mRFP-encoding plasmid was cotransfected for the visualization of transfected cells. Anti-CD29 or control IgM antibody was added to the medium 2 and 4 days after transfection. Scale bar, 50 μm. J, TNDT of transfected cells. Cell images were obtained from three independent culture batches (GFP/IgM, n = 42; GFP/α-CD29, n = 45; Cyr61-GFP/IgM, n = 46; Cyr61-GFP/α-CD29, n = 45). The data are expressed as mean ± S.E. ***, p < 0.001 (Kruskal-Wallis test followed by Dunn's post hoc test); ns, not significant.

Similar articles

Cited by

References

    1. Stuart G., Spruston N., Häusser M. (2007) Dendrites, 2nd Ed., Oxford University Press, Oxford
    1. Segev I., London M. (2000) Untangling dendrites with quantitative models. Science 290, 744–750 - PubMed
    1. Urbanska M., Blazejczyk M., Jaworski J. (2008) Molecular basis of dendritic arborization. Acta Neurobiol. Exp. 68, 264–288 - PubMed
    1. Jan Y. N., Jan L. Y. (2010) Branching out. Mechanisms of dendritic arborization. Nat. Rev. Neurosci. 11, 316–328 - PMC - PubMed
    1. Jaworski J., Spangler S., Seeburg D. P., Hoogenraad C. C., Sheng M. (2005) Control of dendritic arborization by the phosphoinositide-3′-kinase-Akt-mammalian target of rapamycin pathway. J. Neurosci. 25, 11300–11312 - PMC - PubMed

Publication types

MeSH terms