

Genome-wide association study identifies novel loci associated with concentrations of four plasma phospholipid fatty acids in the de novo lipogenesis pathway: results from the Cohorts for Heart and Aging Research in Genomic Epidemiology (CHARGE) consortium
- PMID: 23362303
- PMCID: PMC3891054
- DOI: 10.1161/CIRCGENETICS.112.964619
Genome-wide association study identifies novel loci associated with concentrations of four plasma phospholipid fatty acids in the de novo lipogenesis pathway: results from the Cohorts for Heart and Aging Research in Genomic Epidemiology (CHARGE) consortium
Abstract
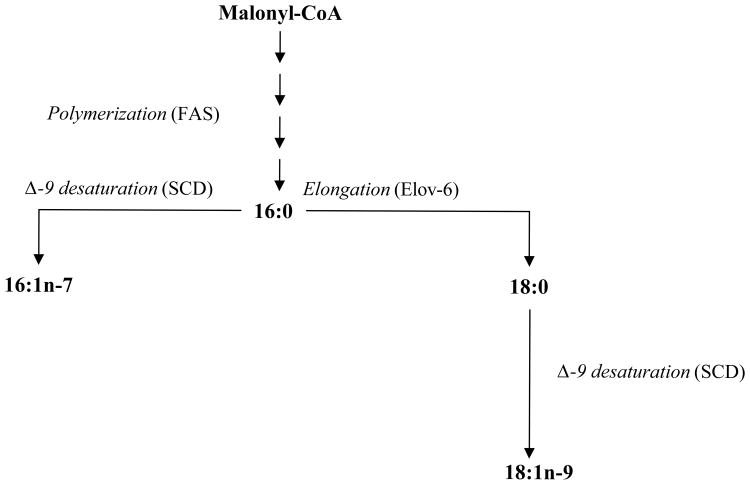
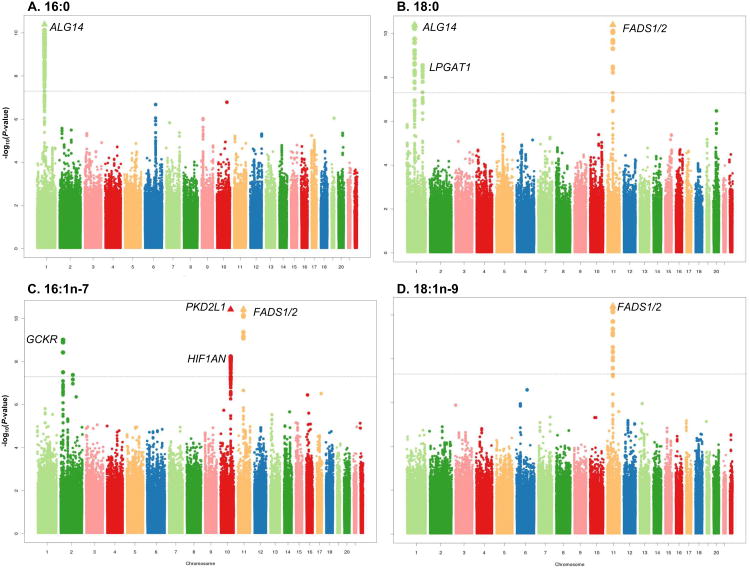
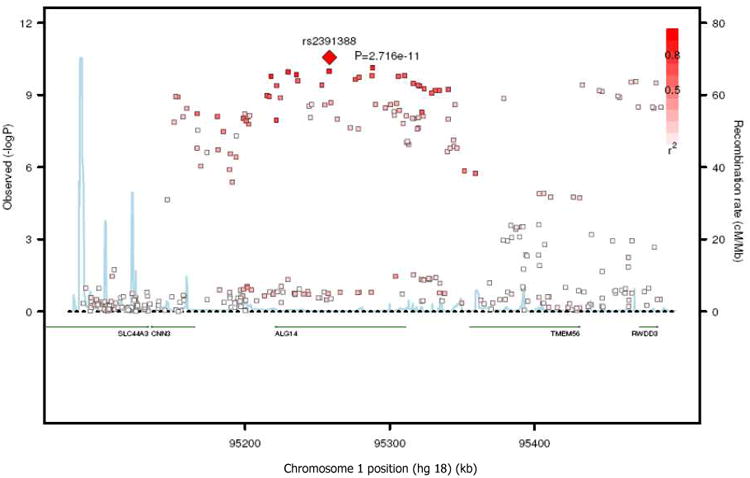
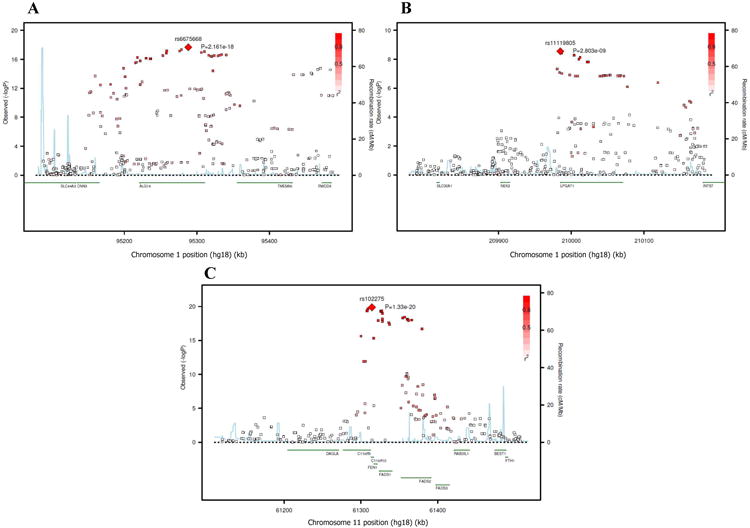
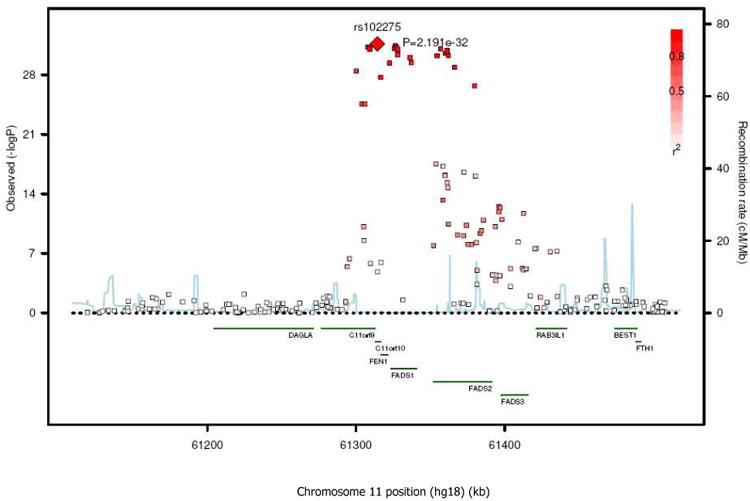
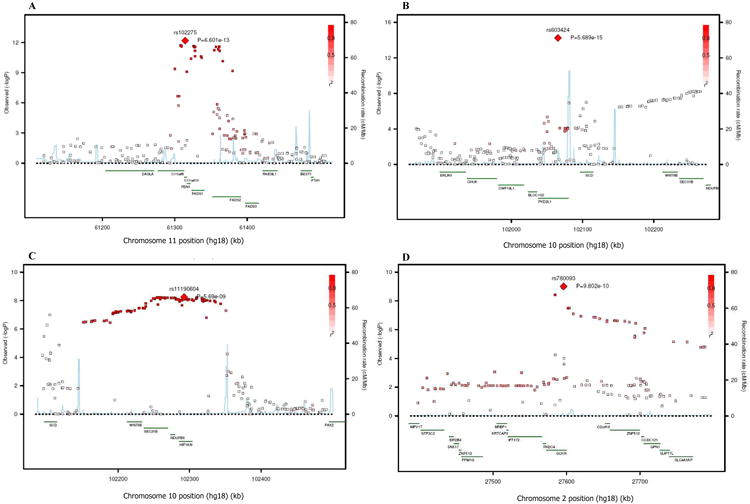
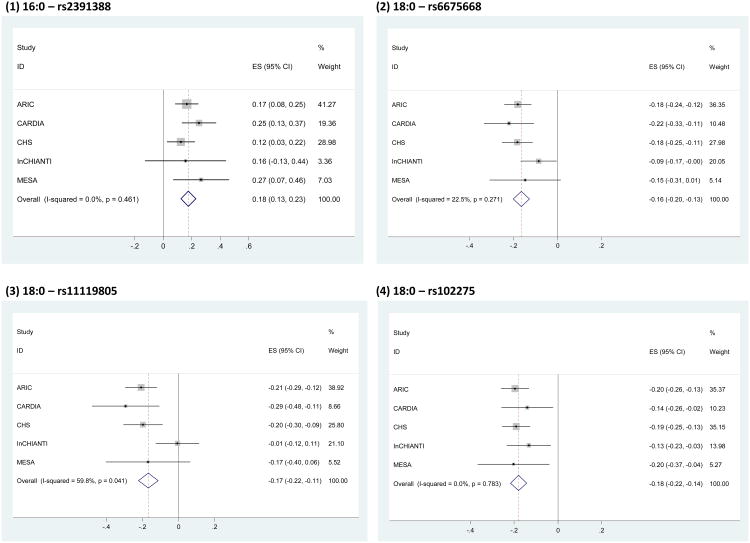
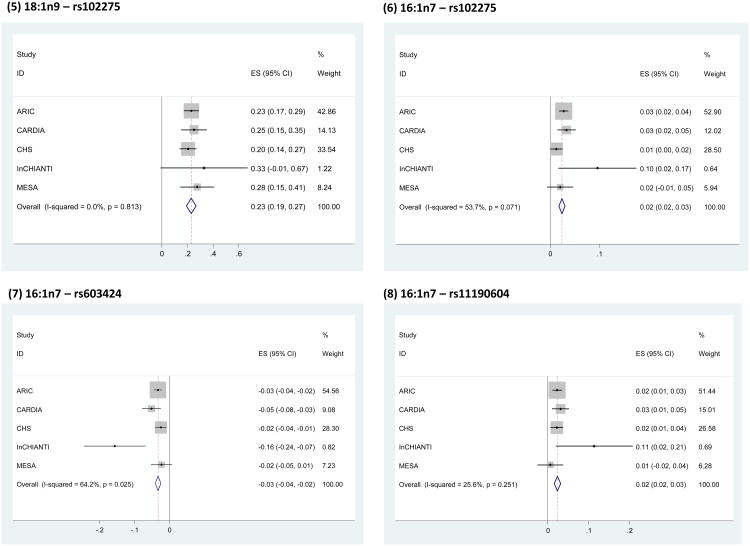
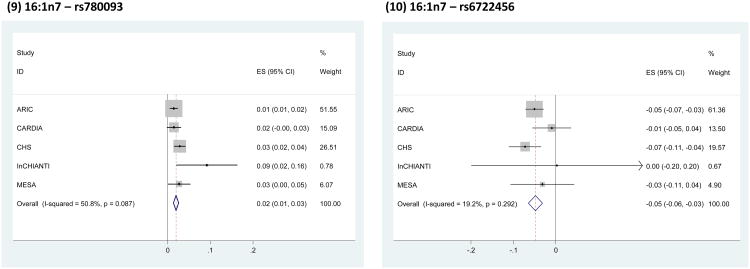
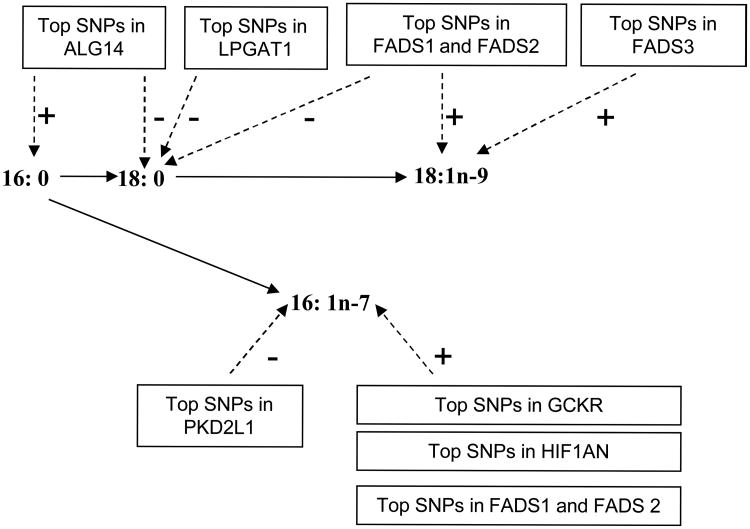
BACKGROUND- Palmitic acid (16:0), stearic acid (18:0), palmitoleic acid (16:1n-7), and oleic acid (18:1n-9) are major saturated and monounsaturated fatty acids that affect cellular signaling and metabolic pathways. They are synthesized via de novo lipogenesis and are the main saturated and monounsaturated fatty acids in the diet. Levels of these fatty acids have been linked to diseases including type 2 diabetes mellitus and coronary heart disease. METHODS AND RESULTS- Genome-wide association studies were conducted in 5 population-based cohorts comprising 8961 participants of European ancestry to investigate the association of common genetic variation with plasma levels of these 4 fatty acids. We identified polymorphisms in 7 novel loci associated with circulating levels of ≥1 of these fatty acids. ALG14 (asparagine-linked glycosylation 14 homolog) polymorphisms were associated with higher 16:0 (P=2.7×10(-11)) and lower 18:0 (P=2.2×10(-18)). FADS1 and FADS2 (desaturases) polymorphisms were associated with higher 16:1n-7 (P=6.6×10(-13)) and 18:1n-9 (P=2.2×10(-32)) and lower 18:0 (P=1.3×10(-20)). LPGAT1 (lysophosphatidylglycerol acyltransferase) polymorphisms were associated with lower 18:0 (P=2.8×10(-9)). GCKR (glucokinase regulator; P=9.8×10(-10)) and HIF1AN (factor inhibiting hypoxia-inducible factor-1; P=5.7×10(-9)) polymorphisms were associated with higher 16:1n-7, whereas PKD2L1 (polycystic kidney disease 2-like 1; P=5.7×10(-15)) and a locus on chromosome 2 (not near known genes) were associated with lower 16:1n-7 (P=4.1×10(-8)). CONCLUSIONS- Our findings provide novel evidence that common variations in genes with diverse functions, including protein-glycosylation, polyunsaturated fatty acid metabolism, phospholipid modeling, and glucose- and oxygen-sensing pathways, are associated with circulating levels of 4 fatty acids in the de novo lipogenesis pathway. These results expand our knowledge of genetic factors relevant to de novo lipogenesis and fatty acid biology.
Conflict of interest statement
Figures
Similar articles
-
Genetic loci associated with circulating phospholipid trans fatty acids: a meta-analysis of genome-wide association studies from the CHARGE Consortium.Am J Clin Nutr. 2015 Feb;101(2):398-406. doi: 10.3945/ajcn.114.094557. Epub 2014 Dec 10. Am J Clin Nutr. 2015. PMID: 25646338 Free PMC article.
-
Serial Plasma Phospholipid Fatty Acids in the De Novo Lipogenesis Pathway and Total Mortality, Cause-Specific Mortality, and Cardiovascular Diseases in the Cardiovascular Health Study.J Am Heart Assoc. 2019 Nov 19;8(22):e012881. doi: 10.1161/JAHA.119.012881. Epub 2019 Nov 12. J Am Heart Assoc. 2019. PMID: 31711385 Free PMC article.
-
Prospective association of fatty acids in the de novo lipogenesis pathway with risk of type 2 diabetes: the Cardiovascular Health Study.Am J Clin Nutr. 2015 Jan;101(1):153-63. doi: 10.3945/ajcn.114.092601. Epub 2014 Nov 12. Am J Clin Nutr. 2015. PMID: 25527759 Free PMC article. Clinical Trial.
-
Genetic loci associated with plasma phospholipid n-3 fatty acids: a meta-analysis of genome-wide association studies from the CHARGE Consortium.PLoS Genet. 2011 Jul;7(7):e1002193. doi: 10.1371/journal.pgen.1002193. Epub 2011 Jul 28. PLoS Genet. 2011. PMID: 21829377 Free PMC article.
-
Discovery and fine-mapping of loci associated with MUFAs through trans-ethnic meta-analysis in Chinese and European populations.J Lipid Res. 2017 May;58(5):974-981. doi: 10.1194/jlr.P071860. Epub 2017 Mar 15. J Lipid Res. 2017. PMID: 28298293 Free PMC article.
Cited by
-
Genetic loci associated with circulating phospholipid trans fatty acids: a meta-analysis of genome-wide association studies from the CHARGE Consortium.Am J Clin Nutr. 2015 Feb;101(2):398-406. doi: 10.3945/ajcn.114.094557. Epub 2014 Dec 10. Am J Clin Nutr. 2015. PMID: 25646338 Free PMC article.
-
Serial Plasma Phospholipid Fatty Acids in the De Novo Lipogenesis Pathway and Total Mortality, Cause-Specific Mortality, and Cardiovascular Diseases in the Cardiovascular Health Study.J Am Heart Assoc. 2019 Nov 19;8(22):e012881. doi: 10.1161/JAHA.119.012881. Epub 2019 Nov 12. J Am Heart Assoc. 2019. PMID: 31711385 Free PMC article.
-
Causal Association of Coffee Consumption and Total, Knee, Hip and Self-Reported Osteoarthritis: A Mendelian Randomization Study.Front Endocrinol (Lausanne). 2021 Nov 10;12:768529. doi: 10.3389/fendo.2021.768529. eCollection 2021. Front Endocrinol (Lausanne). 2021. PMID: 34858340 Free PMC article.
-
Identification of genes for controlling swine adipose deposition by integrating transcriptome, whole-genome resequencing, and quantitative trait loci data.Sci Rep. 2016 Mar 21;6:23219. doi: 10.1038/srep23219. Sci Rep. 2016. PMID: 26996612 Free PMC article.
-
Causal Association Between Tea Consumption and Bone Health: A Mendelian Randomization Study.Front Nutr. 2022 Apr 26;9:872451. doi: 10.3389/fnut.2022.872451. eCollection 2022. Front Nutr. 2022. PMID: 35558741 Free PMC article.
References
-
- Hellerstein MK, Schwarz JM, Neese RA. Regulation of hepatic de novo lipogenesis in humans. Annu Rev Nutr. 1996;16:523–557. - PubMed
-
- King IB, Lemaitre RN, Kestin M. Effect of a low-fat diet on fatty acid composition in red cells, plasma phospholipids, and cholesterol esters: Investigation of a biomarker of total fat intake. Am J Clin Nutr. 2006;83:227–236. - PubMed
-
- Raatz SK, Bibus D, Thomas W, Kris-Etherton P. Total fat intake modifies plasma fatty acid composition in humans. J Nutr. 2001;131:231–234. - PubMed
-
- Siler SQ, Neese RA, Hellerstein MK. De novo lipogenesis, lipid kinetics, and whole-body lipid balances in humans after acute alcohol consumption. Am J Clin Nutr. 1999;70:928–936. - PubMed
Publication types
MeSH terms
Substances
Grants and funding
- R01 HL059367/HL/NHLBI NIH HHS/United States
- U01 HG004729/HG/NHGRI NIH HHS/United States
- R01HL086694/HL/NHLBI NIH HHS/United States
- HHSN268201100012C/HL/NHLBI NIH HHS/United States
- UL1RR025005/RR/NCRR NIH HHS/United States
- N02-HL-6-4278/HL/NHLBI NIH HHS/United States
- UL1 RR033176/RR/NCRR NIH HHS/United States
- N01 HC045204/HL/NHLBI NIH HHS/United States
- N01 HC095095/HL/NHLBI NIH HHS/United States
- HHSN268201100009I/HL/NHLBI NIH HHS/United States
- N01-HC-45205/HC/NHLBI NIH HHS/United States
- R01 HL075366/HL/NHLBI NIH HHS/United States
- U01-HG-004446/HG/NHGRI NIH HHS/United States
- N01-HC-05187/HC/NHLBI NIH HHS/United States
- R01 HG004960/HG/NHGRI NIH HHS/United States
- R01 HL071251/HL/NHLBI NIH HHS/United States
- U01 HG004446/HG/NHGRI NIH HHS/United States
- N01 HC048048/HL/NHLBI NIH HHS/United States
- R01HL59367/HL/NHLBI NIH HHS/United States
- HHSN268201100010C/HL/NHLBI NIH HHS/United States
- R01 HL071259/HL/NHLBI NIH HHS/United States
- UL1 RR025005/RR/NCRR NIH HHS/United States
- R01 AG015928/AG/NIA NIH HHS/United States
- R01 HL085710/HL/NHLBI NIH HHS/United States
- HHSN268201100008C/HL/NHLBI NIH HHS/United States
- U01 HL080295/HL/NHLBI NIH HHS/United States
- N01-HC-48047/HC/NHLBI NIH HHS/United States
- N01 HC095169/HL/NHLBI NIH HHS/United States
- HHSN268201100005G/HL/NHLBI NIH HHS/United States
- R01 HL071252/HL/NHLBI NIH HHS/United States
- HHSN268201100008I/HL/NHLBI NIH HHS/United States
- HHSN268201100007C/HL/NHLBI NIH HHS/United States
- HL105756/HL/NHLBI NIH HHS/United States
- R01 MD009164/MD/NIMHD NIH HHS/United States
- RR-024156/RR/NCRR NIH HHS/United States
- N01 HC085086/HL/NHLBI NIH HHS/United States
- 263 MD 821336/MD/NIMHD NIH HHS/United States
- R56 AG020098/AG/NIA NIH HHS/United States
- HHSN268201100011I/HL/NHLBI NIH HHS/United States
- HHSN268201100011C/HL/NHLBI NIH HHS/United States
- R01 HL086694/HL/NHLBI NIH HHS/United States
- N01 HC048049/HL/NHLBI NIH HHS/United States
- UL1 RR024156/RR/NCRR NIH HHS/United States
- N01-HC-45204/HC/NHLBI NIH HHS/United States
- R01 HL071250/HL/NHLBI NIH HHS/United States
- N01-HC-95159/HC/NHLBI NIH HHS/United States
- R01 HL087652/HL/NHLBI NIH HHS/United States
- AG-20098/AG/NIA NIH HHS/United States
- N01-HC-95095/HC/NHLBI NIH HHS/United States
- U01 HG004402/HG/NHGRI NIH HHS/United States
- U01 HG004424/HG/NHGRI NIH HHS/United States
- HL087652/HL/NHLBI NIH HHS/United States
- UL1 TR000124/TR/NCATS NIH HHS/United States
- R01-HL-084099/HL/NHLBI NIH HHS/United States
- R01HL071252/HL/NHLBI NIH HHS/United States
- N01-HC-85086/HC/NHLBI NIH HHS/United States
- N01 HC095159/HL/NHLBI NIH HHS/United States
- U01HG004402/HG/NHGRI NIH HHS/United States
- AG-027058/AG/NIA NIH HHS/United States
- N01-HC-48050/HC/NHLBI NIH HHS/United States
- R01 HL105756/HL/NHLBI NIH HHS/United States
- N01 HC045205/HL/NHLBI NIH HHS/United States
- R01HL071205/HL/NHLBI NIH HHS/United States
- HL075366/HL/NHLBI NIH HHS/United States
- HHSN268201100006C/HL/NHLBI NIH HHS/United States
- P30 DK063491/DK/NIDDK NIH HHS/United States
- R01 HL071051/HL/NHLBI NIH HHS/United States
- R01HL087641/HL/NHLBI NIH HHS/United States
- U01-HG-004424/HG/NHGRI NIH HHS/United States
- N01 HC055222/HL/NHLBI NIH HHS/United States
- N01-HC-95169/HC/NHLBI NIH HHS/United States
- HHSN268201100005I/HL/NHLBI NIH HHS/United States
- N01-HC-55222/HC/NHLBI NIH HHS/United States
- N01-HC-48049/HC/NHLBI NIH HHS/United States
- N01-HC-75150/HC/NHLBI NIH HHS/United States
- R01 HL084099/HL/NHLBI NIH HHS/United States
- N01 HC045134/HC/NHLBI NIH HHS/United States
- N01 HC005187/HL/NHLBI NIH HHS/United States
- N01 HC085079/HL/NHLBI NIH HHS/United States
- R01 HL080295/HL/NHLBI NIH HHS/United States
- N01 HC048047/HL/NHLBI NIH HHS/United States
- ImNIH/Intramural NIH HHS/United States
- R01 AG020098/AG/NIA NIH HHS/United States
- U01-HG-004729/HG/NHGRI NIH HHS/United States
- 5K01DK082729-02/DK/NIDDK NIH HHS/United States
- HHSN268201100005C/HL/NHLBI NIH HHS/United States
- R01 HL071205/HL/NHLBI NIH HHS/United States
- DK063491/DK/NIDDK NIH HHS/United States
- HHSN268201100009C/HL/NHLBI NIH HHS/United States
- N01 HC048050/HL/NHLBI NIH HHS/United States
- HHSN268201100007I/HL/NHLBI NIH HHS/United States
- N01-HC-85079/HC/NHLBI NIH HHS/United States
- HL080295/HL/NHLBI NIH HHS/United States
- K01 DK082729/DK/NIDDK NIH HHS/United States
- R01HL071259/HL/NHLBI NIH HHS/United States
- N01-HC-85239/HC/NHLBI NIH HHS/United States
- N01-HC-48048/HC/NHLBI NIH HHS/United States
- AG-023629/AG/NIA NIH HHS/United States
- R01HL071251/HL/NHLBI NIH HHS/United States
- N01 HC075150/HL/NHLBI NIH HHS/United States
- R01 AG023629/AG/NIA NIH HHS/United States
- R01 HL087641/HL/NHLBI NIH HHS/United States
- R01HL071258/HL/NHLBI NIH HHS/United States
- R01 AG027058/AG/NIA NIH HHS/United States
- 263 MD 9164/MD/NIMHD NIH HHS/United States
- R01HL071051/HL/NHLBI NIH HHS/United States
- R01 HL071258/HL/NHLBI NIH HHS/United States
- R56 AG023629/AG/NIA NIH HHS/United States
- R01HL071250/HL/NHLBI NIH HHS/United States
- UL 1RR033176/RR/NCRR NIH HHS/United States
LinkOut - more resources
Full Text Sources
Other Literature Sources
