. 2013 Apr;54(4):523-31.
doi: 10.2967/jnumed.112.111336. Epub 2013 Jan 29.

15O PET measurement of blood flow and oxygen consumption in cold-activated human brown fat

Affiliations

15O PET measurement of blood flow and oxygen consumption in cold-activated human brown fat

Otto Muzik et al. J Nucl Med. 2013 Apr.

Abstract

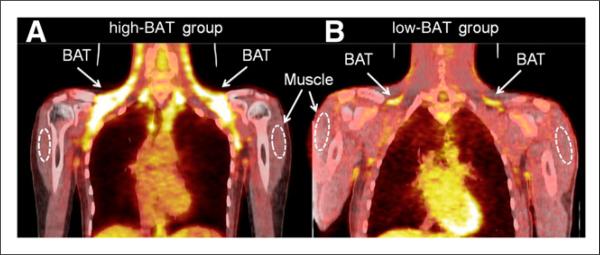
Although it has been believed that brown adipose tissue (BAT) depots disappear shortly after the perinatal period in humans, PET imaging using the glucose analog (18)F-FDG has shown unequivocally the existence of functional BAT in adult humans, suggesting that many humans retain some functional BAT past infancy. The objective of this study was to determine to what extent BAT thermogenesis is activated in adults during cold stress and to establish the relationship between BAT oxidative metabolism and (18)F-FDG tracer uptake.

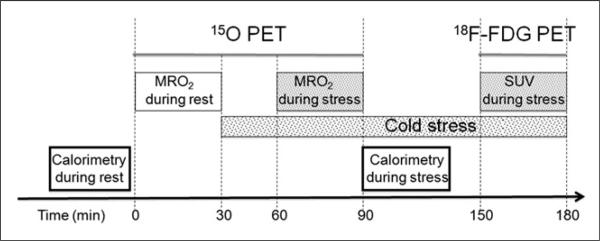
Methods: Twenty-five healthy adults (15 women and 10 men; mean age ± SD, 30 ± 7 y) underwent triple-oxygen scans (H2(15)O, C(15)O, and (15)O2) as well as measurements of daily energy expenditure (DEE; kcal/d) both at rest and after exposure to mild cold (15.5°C [60°F]) using indirect calorimetry. The subjects were divided into 2 groups (high BAT and low BAT) based on the presence or absence of (18)F-FDG tracer uptake (standardized uptake value [SUV] > 2) in cervical-supraclavicular BAT. Blood flow and oxygen extraction fraction (OEF) were calculated from dynamic PET scans at the location of BAT, muscle, and white adipose tissue. Regional blood oxygen saturation was determined by near-infrared spectroscopy. The total energy expenditure during rest and mild cold stress was measured by indirect calorimetry. Tissue-level metabolic rate of oxygen (MRO2) in BAT was determined and used to calculate the contribution of activated BAT to DEE.

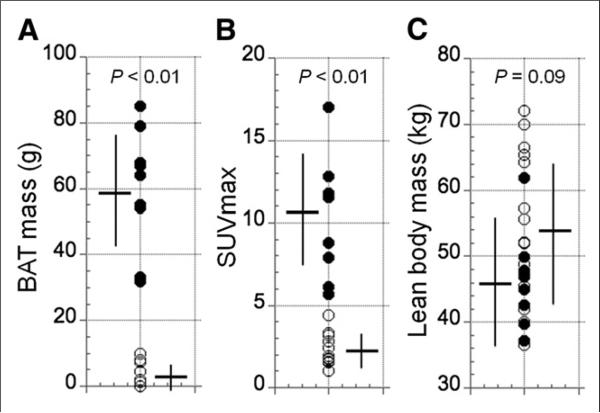
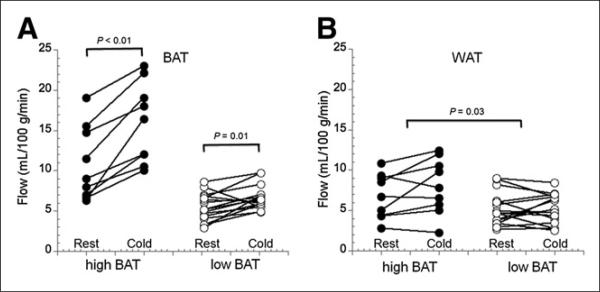
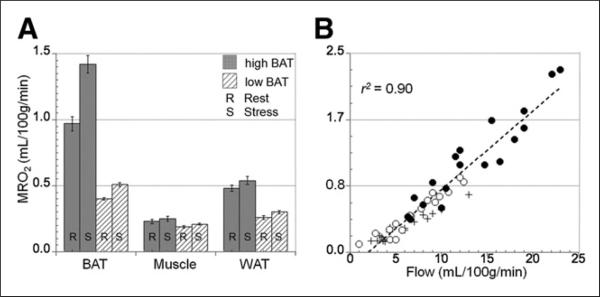
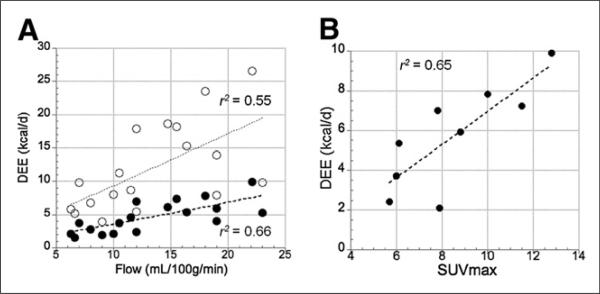
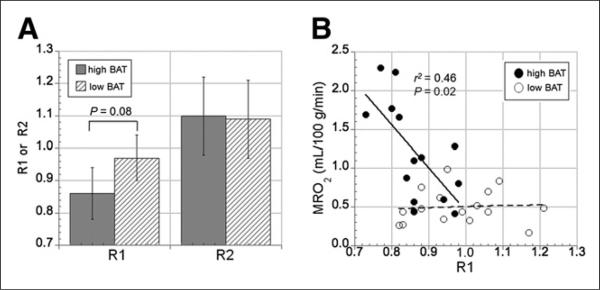
Results: The mass of activated BAT was 59.1 ± 17.5 g (range, 32-85 g) in the high-BAT group (8 women and 1 man; mean age, 29.6 ± 5.5 y) and 2.2 ± 3.6 g (range, 0-9.3 g) in the low-BAT group (9 men and 7 women; mean age, 31.4 ± 10 y). Corresponding maximal SUVs were significantly higher in the high-BAT group than in the low-BAT group (10.7 ± 3.9 vs. 2.1 ± 0.7, P = 0.01). Blood flow values were significantly higher in the high-BAT group than in the low-BAT group for BAT (12.9 ± 4.1 vs. 5.9 ± 2.2 mL/100 g/min, P = 0.03) and white adipose tissue (7.2 ± 3.4 vs. 5.7 ± 2.3 mL/100 g/min, P = 0.03) but were similar for muscle (4.4 ± 1.9 vs. 3.9 ± 1.7 mL/100 g/min). Moreover, OEF in BAT was similar in the 2 groups (0.51 ± 0.17 in high-BAT group vs. 0.47 ± 0.18 in low-BAT group, P = 0.39). During mild cold stress, calculated MRO2 values in BAT increased from 0.97 ± 0.53 to 1.42 ± 0.68 mL/100 g/min (P = 0.04) in the high-BAT group and were significantly higher than those determined in the low-BAT group (0.40 ± 0.28 vs. 0.51 ± 0.23, P = 0.67). The increase in DEE associated with BAT oxidative metabolism was highly variable in the high-BAT group, with an average of 3.2 ± 2.4 kcal/d (range, 1.9-4.6 kcal/d) at rest, and increased to 6.3 ± 3.5 kcal/d (range, 4.0-9.9 kcal/d) during exposure to mild cold. Although BAT accounted for only a small fraction of the cold-induced increase in DEE, such increases were not observed in subjects lacking BAT.

Conclusion: Mild cold-induced thermogenesis in BAT accounts for 15-25 kcal/d in subjects with relatively large BAT depots. Thus, although the presence of active BAT is correlated with cold-induced energy expenditure, direct measurement of MRO2 indicates that BAT is a minor source of thermogenesis in humans.


Figures

FIGURE 1
FIGURE 1
PET protocol used to quantify MRO2 in BAT at rest and during cold stress. After quantitative assessment of oxidative metabolism, patient underwent 18F-FDG PET/CT to correlate MRO2 with 18F-FDG–derived SUV measures. Indirect calorimetry was performed at rest and during exposure to cold stress.
FIGURE 2
FIGURE 2
Representative images showing BAT 18F-FDG uptake in subjects belonging to high-BAT and low-BAT groups. Presence of cold-activated BAT was derived on basis of combined conditions of HU range (–250 to –50) and SUV >. 2. ROIs were defined at location of shoulder muscle (broken line) and WAT (not shown). (A) Nine of 25 subjects showed spatially extensive cold-activated BAT (high-BAT group, mass > 10 g). (B). The remaining 16 subjects showed either no cold-activated BAT or only small depots (low-BAT group, mass < 10 g).
FIGURE 3
FIGURE 3
Distribution of amount of BAT mass, maximal SUV, and lean body mass in high-BAT group (●, n = 9, 8 women and 1 man) and in low-BAT group (○, n = 16, 7 women and 9 men). Error bars represent SD of measurements. (A) Amount of BAT mass was highly variable, displaying bimodal distribution. Accordingly, subjects were stratified into high-BAT and low-BAT groups. (B) Maximal SUV in BAT was significantly higher in high-BAT group than in low-BAT group (P < 0.01). (C) Because of higher male-to-female ratio in low-BAT group, lean body mass showed tendency toward higher values in low-BAT group.
FIGURE 4
FIGURE 4
Absolute blood flow during rest and cold stress in BAT and WAT in high-BAT and low-BAT groups. (A) Blood flow in activated BAT (high-BAT) is about 50% higher than in nonactivated BAT (low-BAT). Increase in blood flow was significantly higher in high-BAT group than in low-BAT group, although both increases were significant between rest and cold stress. (B) Blood flow in WAT was significantly higher in high-BAT group at both rest and cold stress than in low-BAT group. However, no significant differences were observed between rest and cold stress in either group.
FIGURE 5
FIGURE 5
MRO2 in BAT, muscle, and WAT observed in high-BAT and low-BAT groups. Error bars represent SEM. (A) In high-BAT group, MRO2 in BAT at rest was about twice as high as that in low-BAT group. After cold exposure, MRO2 increased by about 50% in high-BAT group but remained at same level in low-BAT group. In contrast, MRO2 in WAT was higher in low-BAT group both at rest and at cold exposure. Finally, MRO2 in muscle was similar for both groups at rest and after cold exposure. (B) Highly significant correlation (P = 0.01) was observed between MRO2 in BAT (●), WAT (○), and muscle (×) tissue, indicating that tissue perfusion is main determinant of oxidative metabolism in all 3 types of tissue.
FIGURE 6
FIGURE 6
(A) Relationship between blood flow in BAT (both at rest and during stress) and BAT DEE (●), as well as estimates of upper limit for BAT DEE (○), calculated using almost complete oxygen extraction (OEF = 0.95) and generous estimate of activated BAT mass (SUV threshold of 1.5). Maximal contribution of activated BAT to DEE is in range of 15–25 kcal/d. We determined significant correlation (P = 0.03), indicating that tissue perfusion is an important determinant of DEE in activated BAT. (B) Correlation between maximal SUV in BAT and DEE in those subjects who had SUV > 2.0 (indicative of activated BAT). We found significant correlation between glucose uptake and DEE (P = 0.02).
FIGURE 7
FIGURE 7
NIRS-derived measures (R1 and R2) in BAT and WAT. (A) Comparison between R1 and R2 in high-BAT (gray bars) and low-BAT (hatched bars) groups. Consistent with higher BAT oxygen depletion in high-BAT group, R1 ratio in this group tended to be significantly lower than in low-BAT group (P = 0.08). R2 ratios were similar in both groups, indicating that oxygen demand in abdominal subcutaneous WAT is comparable in the 2 groups. (B) Relationship between BAT MRO2 and R1 in both high-BAT (●) and low-BAT (○) groups. Significant correlation between R1 and MRO2 was observed in high-BAT group, indicating higher oxygen depletion in venous blood (reflected in low R1 values) at high MRO2 in BAT. In contrast, no significant relationship between R1 and MRO2 was found in low-BAT group.

References

    1. Foster DO, Frydman ML. Tissue distribution of cold-induced thermogenesis in conscious warm- or cold-acclimated rats reevaluated from changes in tissue blood flow: the dominant role of brown adipose tissue in the replacement of shivering by nonshivering thermogenesis. Can J Physiol Pharmacol. 1979;57:257–270. - PubMed
    1. Nedergaard J, Golozoubova V, Matthias A, Asadi A, Jacobsson A, Cannon B. UCP1: the only protein able to mediate adaptive non-shivering thermogenesis and metabolic inefficiency. Biochim Biophys Acta. 2001;1504:82–106. - PubMed
    1. Dawkins MJ, Scopes JW. Non-shivering thermogenesis and brown adipose tissue in the human new-born infant. Nature. 1965;206:201–202. - PubMed
    1. Blaza S. Brown adipose tissue in man: a review. J R Soc Med. 1983;76:213–216. - PMC - PubMed
    1. Cypess AM, Lehman S, Williams G, et al. Identification and importance of brown adipose tissue in adult humans. N Engl J Med. 2009;360:1509–1517. - PMC - PubMed

Publication types

MeSH terms