

A Weber-like law for perceptual learning
- PMID: 23362458
- PMCID: PMC3557449
- DOI: 10.1038/srep01158
A Weber-like law for perceptual learning
Abstract
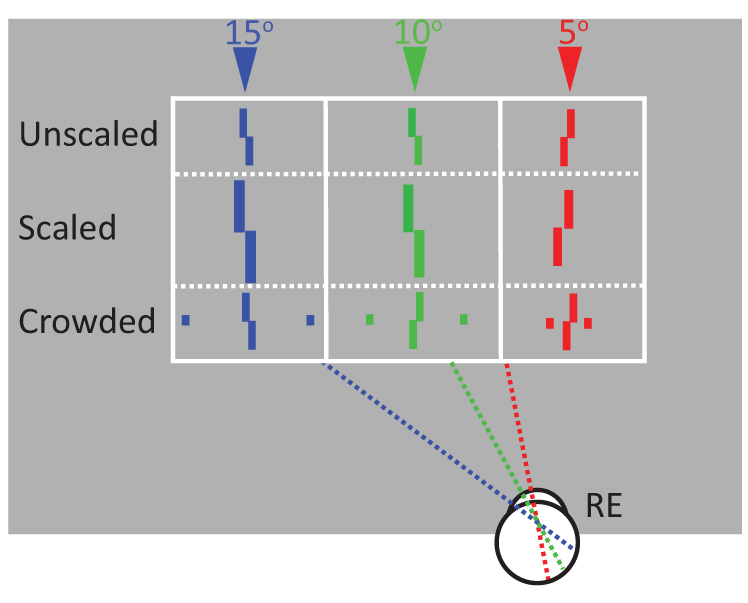
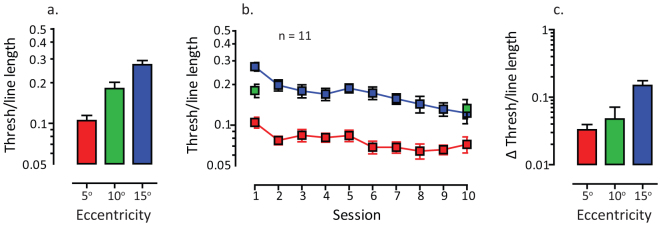
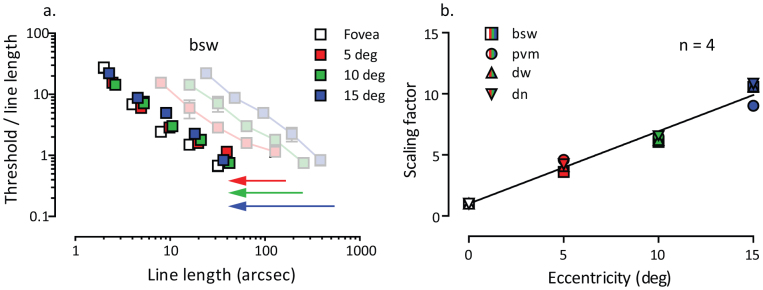
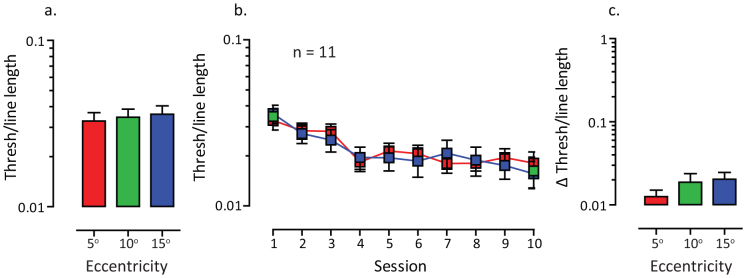
What determines how much an organism can learn? One possibility is that the neural factors that limit sensory performance prior to learning, place an upper limit on the amount of learning that can take place. We tested this idea by comparing learning on a sensory task where performance is limited by cortical mechanisms, at two retinal eccentricities. Prior to learning, visual performance at the two eccentricities was either unmatched or equated in two different ways (through spatial scaling or visual crowding). The magnitude of learning was equivalent when initial levels of performance were matched regardless of how performance was equated. The magnitude of learning was a constant proportion of initial performance. This Weber-like law for perceptual learning demonstrates that it should be possible to predict the degree of perceptual improvement and the final level of performance that can be achieved via sensory training, regardless of what cortical constraint limits performance.
Figures
Similar articles
-
The relationship between initial threshold, learning, and generalization in perceptual learning.J Vis. 2019 Apr 1;19(4):28. doi: 10.1167/19.4.28. J Vis. 2019. PMID: 31022729 Free PMC article.
-
Task precision at transfer determines specificity of perceptual learning.J Vis. 2009 Mar 5;9(3):1.1-13. doi: 10.1167/9.3.1. J Vis. 2009. PMID: 19757940 Free PMC article.
-
Specificity of perceptual learning increases with increased training.Vision Res. 2010 Sep 15;50(19):1928-40. doi: 10.1016/j.visres.2010.06.016. Epub 2010 Jul 16. Vision Res. 2010. PMID: 20624413 Free PMC article.
-
Visual Perceptual Learning and Models.Annu Rev Vis Sci. 2017 Sep 15;3:343-363. doi: 10.1146/annurev-vision-102016-061249. Epub 2017 Jul 19. Annu Rev Vis Sci. 2017. PMID: 28723311 Free PMC article. Review.
-
Auditory perceptual learning and changes in the conceptualization of auditory cortex.Hear Res. 2018 Sep;366:3-16. doi: 10.1016/j.heares.2018.03.011. Epub 2018 Mar 12. Hear Res. 2018. PMID: 29551308 Review.
Cited by
-
Dichoptic Perceptual Training in Children With Amblyopia With or Without Patching History.Invest Ophthalmol Vis Sci. 2021 May 3;62(6):4. doi: 10.1167/iovs.62.6.4. Invest Ophthalmol Vis Sci. 2021. PMID: 33944893 Free PMC article.
-
Training improves visual processing speed and generalizes to untrained functions.Sci Rep. 2014 Nov 28;4:7251. doi: 10.1038/srep07251. Sci Rep. 2014. PMID: 25431233 Free PMC article.
-
The effect of normal aging and age-related macular degeneration on perceptual learning.J Vis. 2015;15(10):16. doi: 10.1167/15.10.16. J Vis. 2015. PMID: 26605694 Free PMC article.
-
Perceptual Learning at Higher Trained Cutoff Spatial Frequencies Induces Larger Visual Improvements.Front Psychol. 2020 Feb 21;11:265. doi: 10.3389/fpsyg.2020.00265. eCollection 2020. Front Psychol. 2020. PMID: 32153473 Free PMC article.
-
Perceptual factors contribute more than acoustical factors to sound localization abilities with virtual sources.Front Neurosci. 2015 Jan 29;8:451. doi: 10.3389/fnins.2014.00451. eCollection 2014. Front Neurosci. 2015. PMID: 25688182 Free PMC article.
References
-
- Gibson E. J. Perceptual learning. Annu. Rev. Psychol. 14, 29–56 (1963). - PubMed
-
- Fahle M. & Poggio T. Perceptual learning. (MIT Press, 2002).
-
- Fine I. & Jacobs R. A. Comparing perceptual learning tasks: A review. J Vis. 2, 190–203 (2002). - PubMed
-
- Tallal P., Merzenich M., Miller S. & Jenkins W. Language learning impairment: Integrating research and remediation. Scand. J. Psychol. 39, 197–199 (1998). - PubMed
Publication types
MeSH terms
Grants and funding
LinkOut - more resources
Full Text Sources
Other Literature Sources
