. 2013 Jul 1;30(13):1147-60.
doi: 10.1089/neu.2012.2652. Epub 2013 Jun 28.

Rat injury model under controlled field-relevant primary blast conditions: acute response to a wide range of peak overpressures

Affiliations

Rat injury model under controlled field-relevant primary blast conditions: acute response to a wide range of peak overpressures

Maciej Skotak et al. J Neurotrauma. .

Abstract

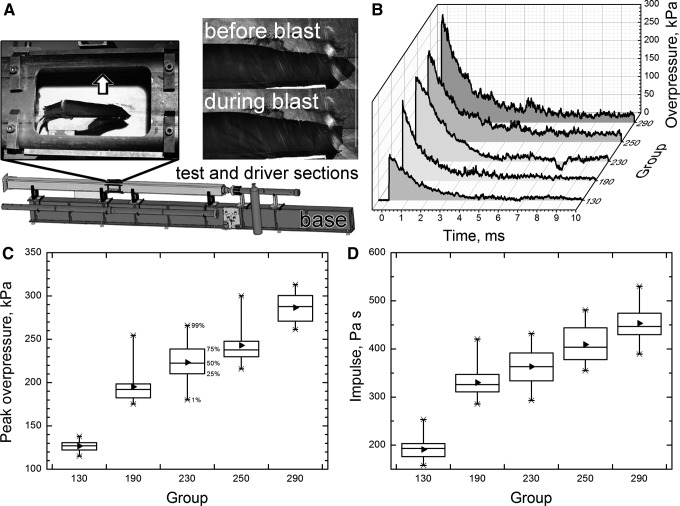
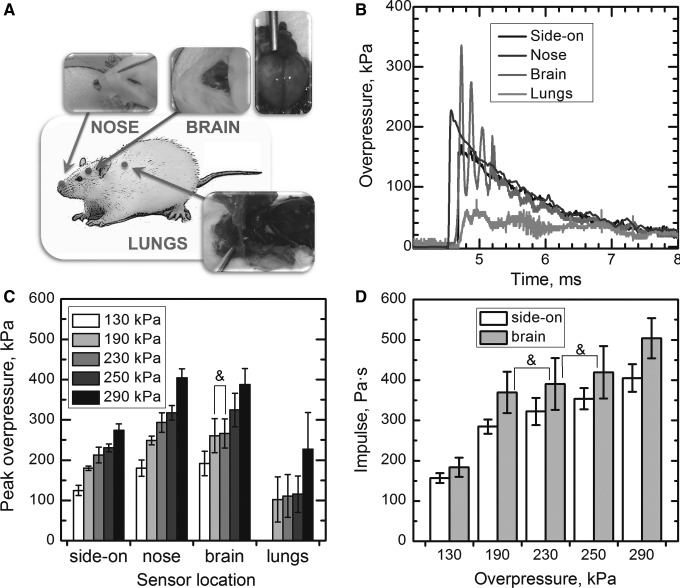
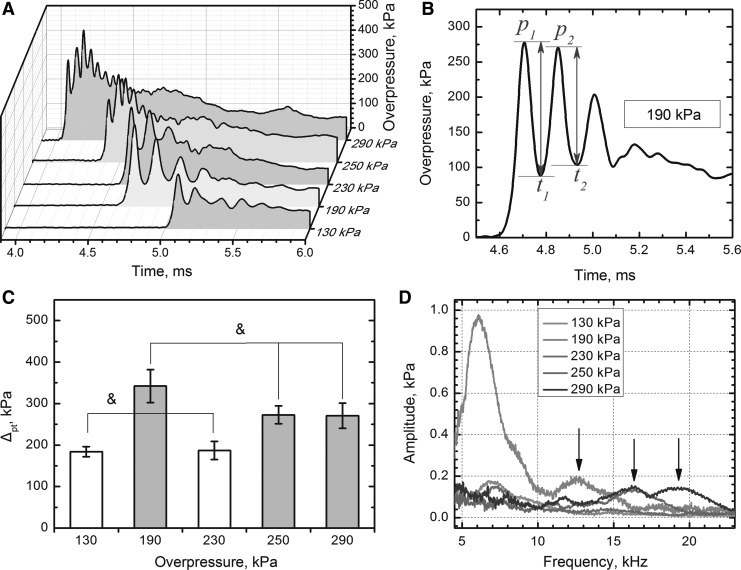
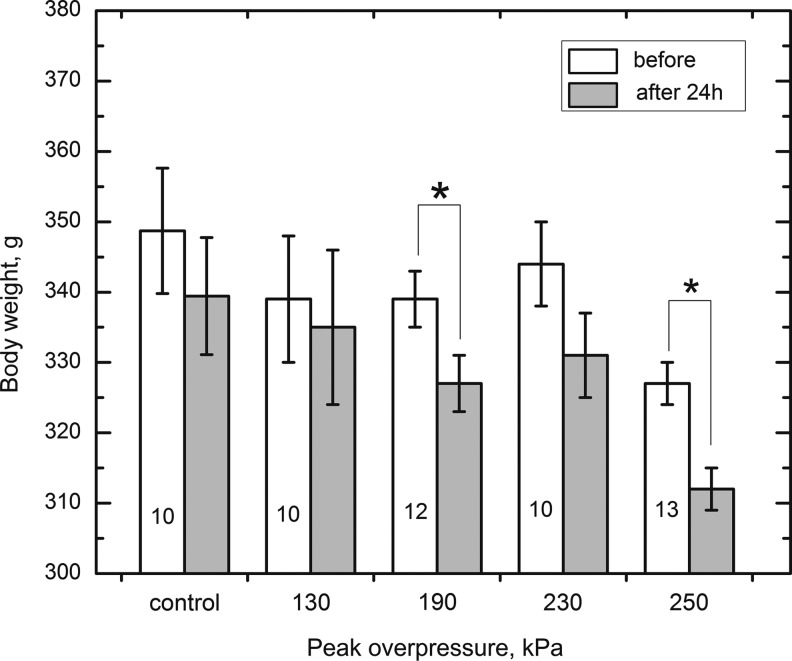
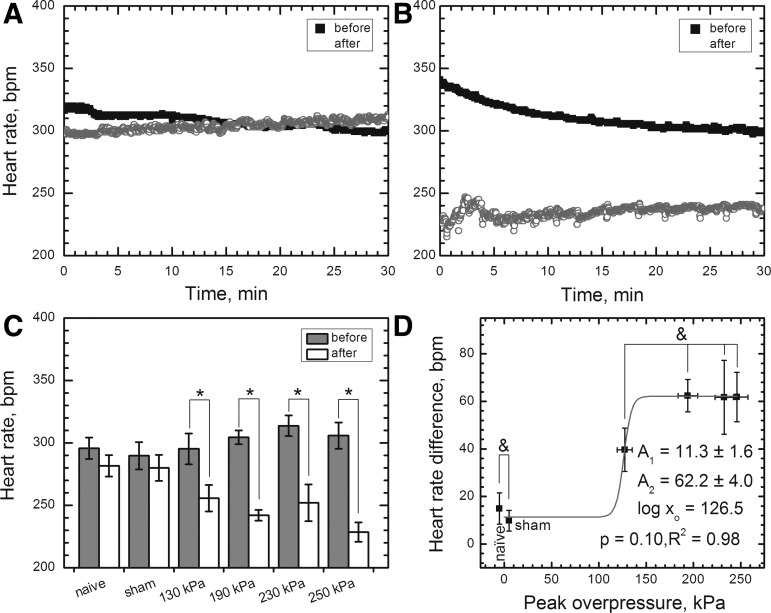
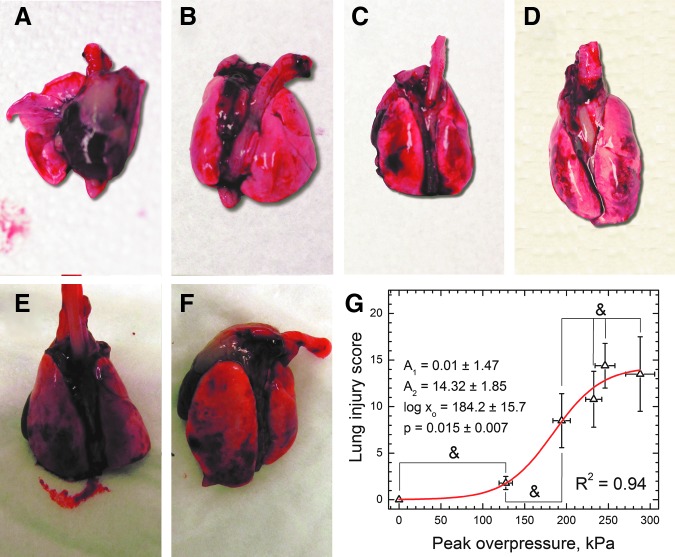
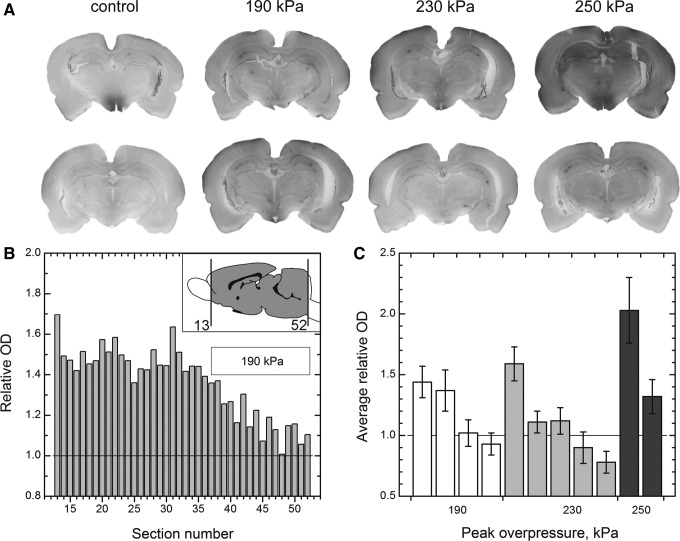
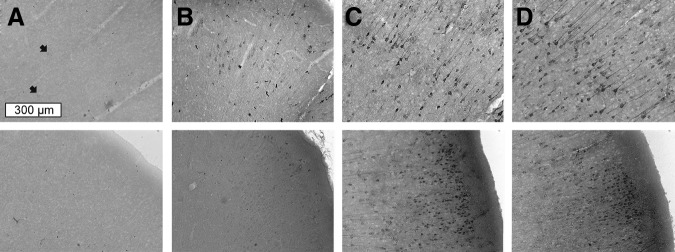
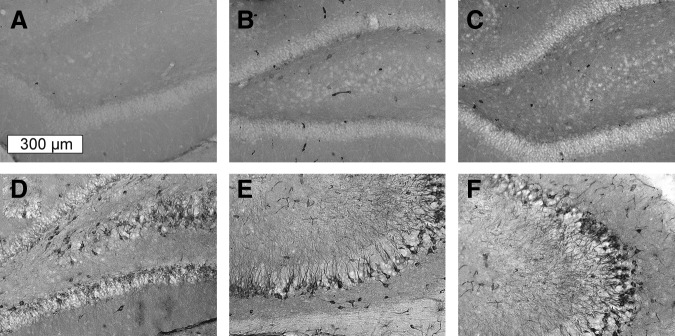
We evaluated the acute (up to 24 h) pathophysiological response to primary blast using a rat model and helium driven shock tube. The shock tube generates animal loadings with controlled pure primary blast parameters over a wide range and field-relevant conditions. We studied the biomechanical loading with a set of pressure gauges mounted on the surface of the nose, in the cranial space, and in the thoracic cavity of cadaver rats. Anesthetized rats were exposed to a single blast at precisely controlled five peak overpressures over a wide range (130, 190, 230, 250, and 290 kPa). We observed 0% mortality rates in 130 and 230 kPa groups, and 30%, 24%, and 100% mortality rates in 190, 250, and 290 kPa groups, respectively. The body weight loss was statistically significant in 190 and 250 kPa groups 24 h after exposure. The data analysis showed the magnitude of peak-to-peak amplitude of intracranial pressure (ICP) fluctuations correlates well with mortality rates. The ICP oscillations recorded for 190, 250, and 290 kPa are characterized by higher frequency (10-20 kHz) than in other two groups (7-8 kHz). We noted acute bradycardia and lung hemorrhage in all groups of rats subjected to the blast. We established the onset of both corresponds to 110 kPa peak overpressure. The immunostaining against immunoglobulin G (IgG) of brain sections of rats sacrificed 24-h post-exposure indicated the diffuse blood-brain barrier breakdown in the brain parenchyma. At high blast intensities (peak overpressure of 190 kPa or more), the IgG uptake by neurons was evident, but there was no evidence of neurodegeneration after 24 h post-exposure, as indicated by cupric silver staining. We observed that the acute response as well as mortality is a non-linear function over the peak overpressure and impulse ranges explored in this work.


Figures

FIG. 1.
FIG. 1.
Schematic representation of the shock tube at UNL blast facility. (A) Left inset illustrates the side-on pressure sensor location (arrow) and the position and strapping of the animal in the holder; right inset: close up high-speed video still images demonstrate the typical head displacement during the blast exposure in our model. Representative overpressure profiles (B), side-on overpressure (C), and impulse values (D) of five blast waves with increasing intensities used in our experiments. These data show significant difference in both overpressure values and impulse, (p<0.05). Box range: 25–75%, whisker range: 1–99% (median: 50%; mean: ►).
FIG. 2.
FIG. 2.
The diagram of sensor locations (A) used in the cadaver rat experiments. The rightmost inset shows the brain remains intact after the experiments. Representative pressure profiles of the 190 kPa group (B), and average peak overpressures recorded by side-on, nose (reflected pressure), brain, and lungs pressure sensors (C) are presented (no statistically significant differences are noted for 190 and 230 kPa groups (marked with ampersand)). There are no statistical differences between intracranial pressure (ICP) impulse of 230 kPa group (100% survival, Table 1) and ICP impulses of the two lethal groups (190 and 250 kPa) (D).
FIG. 3.
FIG. 3.
Representative pressure traces for five exposure groups (A). The signal was smoothed using Fast Fourier Transformation (FFT) band pass filter for the clarity of presentation. (B) Schematic representation of peak-trough analysis on overpressure recorded by brain sensor: Δpt is a sum of the first two peak-to-peak amplitudes. Results of peak-trough analysis: (C) Lethal groups (190, 250 and 290 kPa) have significantly higher Δpt (p<0.05) compared with non-lethal groups (130 and 230 kPa). There are no statistically significant differences between Δpt in respective non-lethal and lethal groups (p>0.05, marked with ampersand). (D) FFT analysis of the intracranial pressure profiles recorded by the sensor implanted in the brain. The high frequency component (peaks marked with arrows, >10 kHz) is present in the signal of lethal groups (190, 250, and 290 kPa).
FIG. 4.
FIG. 4.
Exposure to different intensity of primary blast results in the body weight decrease in groups 190 and 250 kPa. In these groups, statistically significant differences (marked with asterisk) were established immediately before and 24 h after the exposure (p<0.05). Numbers of animals used in respective tests are provided in the bars corresponding to each group.
FIG. 5.
FIG. 5.
Representative experimental data demonstrating blast-related bradycardia in the rat model: (A) naïve control; (B) rat exposed to 190 kPa peak overpressure (sampling rate 1 Hz in both cases). (C) The heart rate monitoring in the acute phase post-exposure revealed the average heartbeat decrease was statistically significant (p<0.05) in animals exposed to blast at peak overpressure of 130 kPa (ΔHR=40±9 beats per minute [bpm]) and higher (average ΔHR=62±11 bpm for 190, 230, and 250 kPa groups). (D) The heart rate difference is not statistically significant between two control and four exposed groups (p>0.05, marked with ampersand) and follows dose response model in the acute phase post-exposure.
FIG. 6.
FIG. 6.
Blast-induced lung injury immediately post-exposure: (A) control, (B) 130 kPa, (C) 190 kPa, (D) 230 kPa, (E) 250 kPa, (F) 290 kPa. The extent of injury was quantified using the Pathology Scoring System for Blast Injuries. The extent of injury is defined by the Elements of the Injury Severity according to the equation (1) and was modeled with dose-response function (G). Groups with no statistically significant differences (p>0.05) are marked with an ampersand. Color image is available online at www.liebertpub.com/neu
FIG. 7.
FIG. 7.
(A) Immunostaining for rat immunoglobulin G (IgG) as an indicator for compromised blood-brain barrier. (B) Relative optical density (OD) of full coronal sections from the brain of a single rat exposed at 190 kPa. The OD of each section was divided by average OD of three controls (two naïve and one sham). Inset illustrates brain region covered in this study. (C) Average relative OD of IgG across the brain parenchyma for rats exposed to primary blast and sacrificed 24 h post-exposure. Error bars are standard deviation.
FIG. 8.
FIG. 8.
The IgG uptake in cortical neurons 24 h after the blast. Coronal sections of the brain were collected from brains of sham control (A) and surviving rats exposed to blast with (B) 190 kPa, (C) 230 kPa, and (D) 250 kPa peak overpressure. The scale bar (300 μm) is the same for all samples. Arrows indicate faintly stained neurons.
FIG. 9.
FIG. 9.
The IgG positive cells in the hippocampus of sham control (A) and in rats exposed to blast overpressure of 190 (B), 230 (C), and 250 kPa (D–F). The scale bar (300 μm) is the same for all samples.

References

    1. Chen Y.C. Smith D.H. Meaney D.F. In-vitro approaches for studying blast-induced traumatic brain injury. J. Neurotrauma. 2009;26:861–876. - PMC - PubMed
    1. Phillips Y.Y. Primary blast injuries. Ann. Emerg. Med. 1986;15:1446–1450. - PubMed
    1. DePalma R.G. Burris D.G. Champion H.R. Hodgson M.J. Blast injuries. N. Engl. J. Med. 2005;352:1335–1342. - PubMed
    1. Zhang J. Wang Z. Leng H. Yang Z. Studies on lung injuries caused by blast underpressure. J. Trauma. 1996;40(Suppl 3):S77–S80. - PubMed
    1. Chandra N. Ganpule S. Kleinschmit N.N. Feng R. Holmberg A.D. Sundaramurthy A. Selvan V. Alai A. Evolution of blast wave profiles in simulated air blasts: experiment and computational modeling. Shock Waves. 2012;22:403–415.

Publication types

LinkOut - more resources