. 2013 Feb 27;135(8):3121-35.
doi: 10.1021/ja310650n. Epub 2013 Feb 14.

Hydroxyl ion addition to one-electron oxidized thymine: unimolecular interconversion of C5 to C6 OH-adducts

Affiliations

Hydroxyl ion addition to one-electron oxidized thymine: unimolecular interconversion of C5 to C6 OH-adducts

Amitava Adhikary et al. J Am Chem Soc. .

Abstract

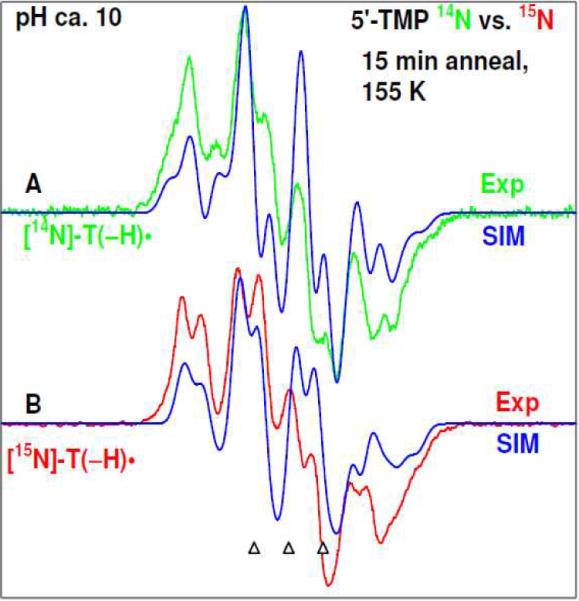
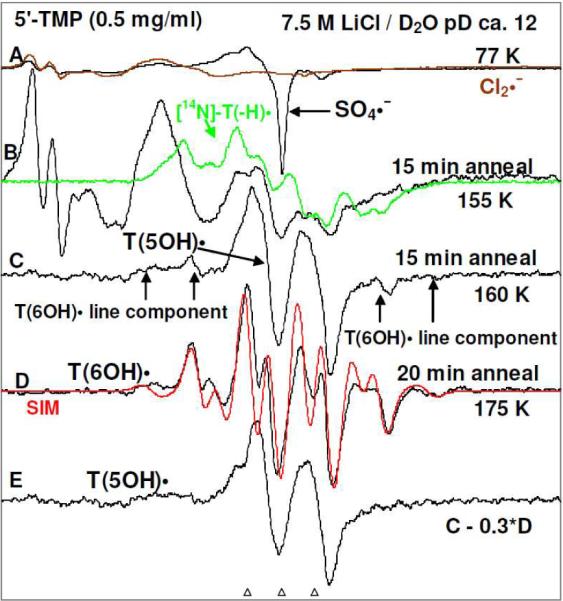
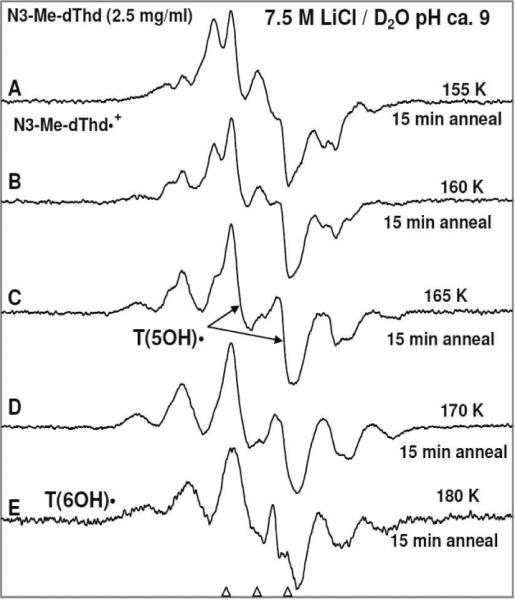
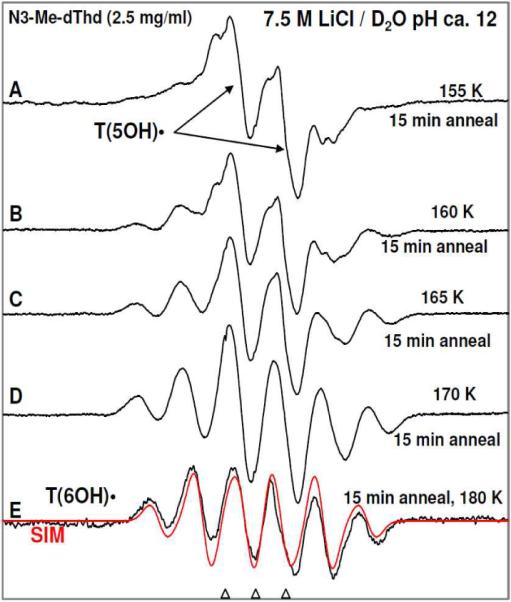
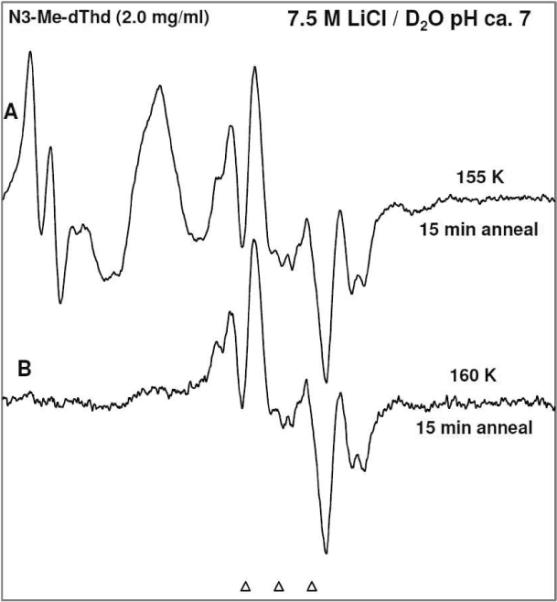
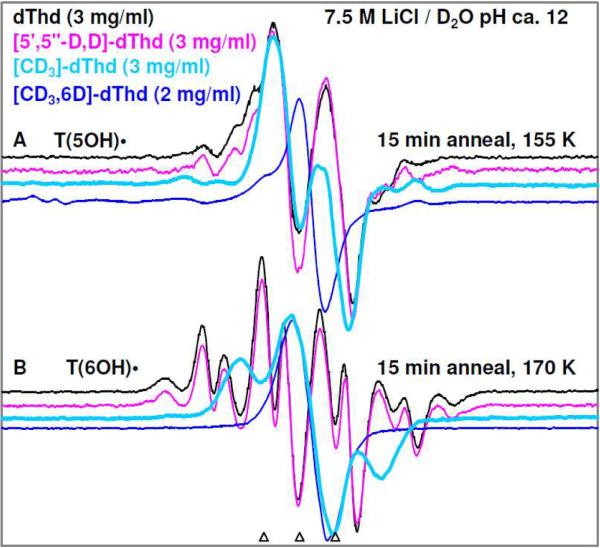
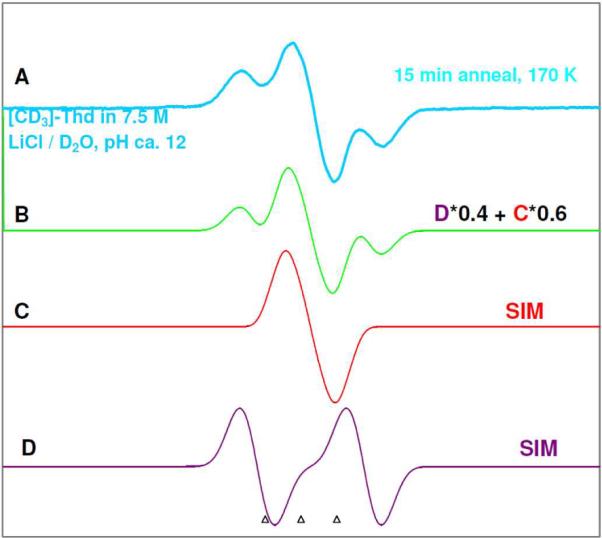
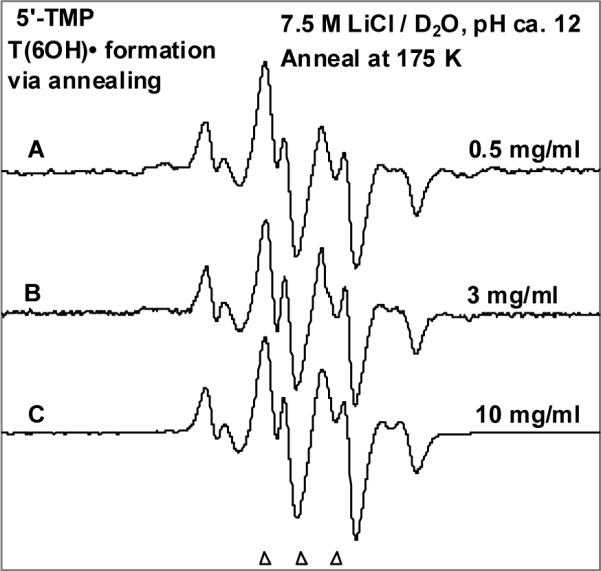
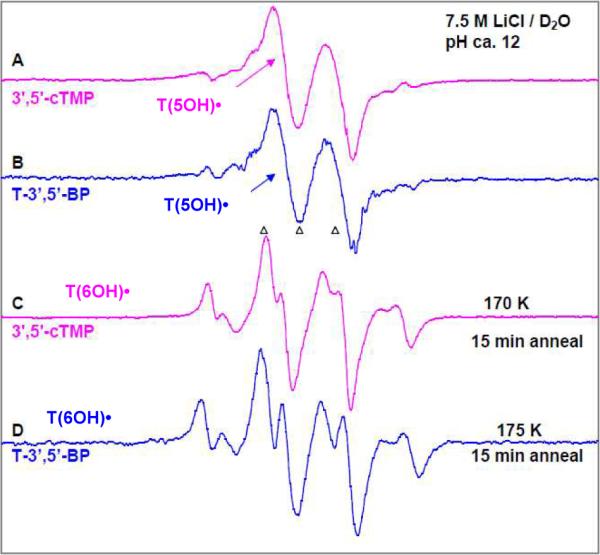
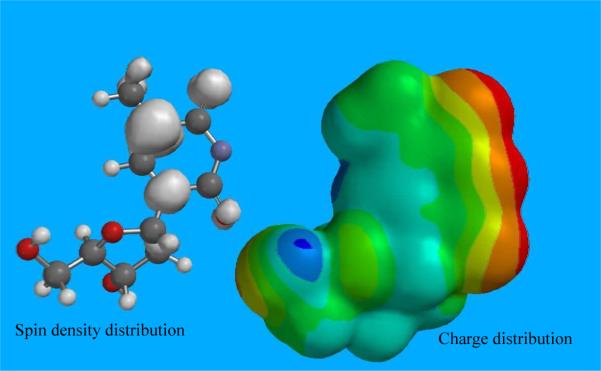
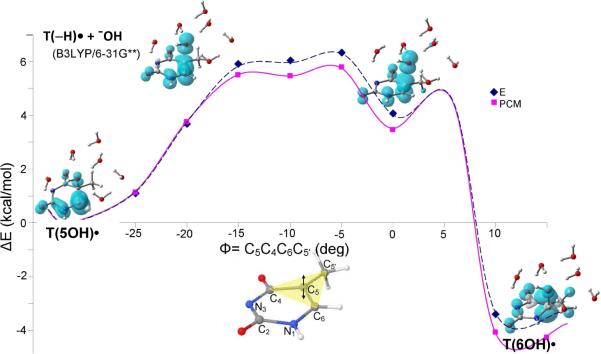
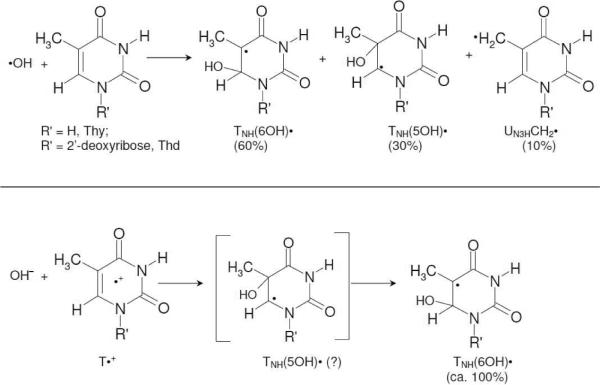
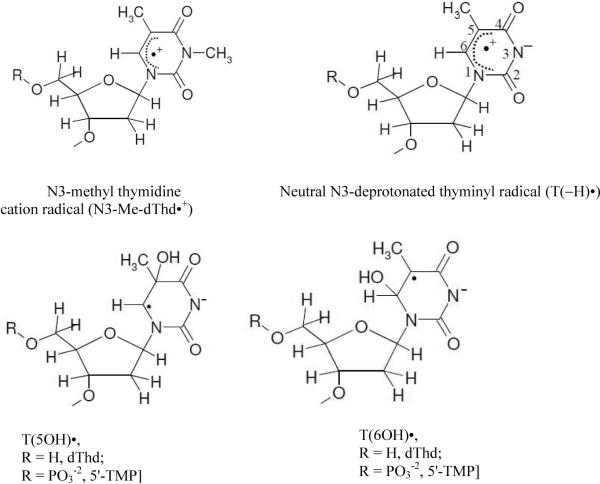
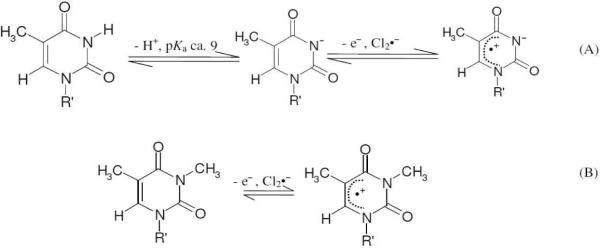
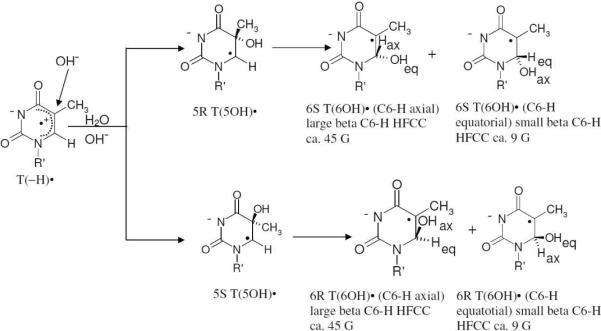
In this work, addition of OH(-) to one-electron oxidized thymidine (dThd) and thymine nucleotides in basic aqueous glasses is investigated. At pHs ca. 9-10 where the thymine base is largely deprotonated at N3, one-electron oxidation of the thymine base by Cl(2)(•-) at ca. 155 K results in formation of a neutral thyminyl radical, T(-H)·. Assignment to T(-H)· is confirmed by employing (15)N substituted 5'-TMP. At pH ≥ ca. 11.5, formation of the 5-hydroxythymin-6-yl radical, T(5OH)·, is identified as a metastable intermediate produced by OH(-) addition to T(-H)· at C5 at ca. 155 K. Upon further annealing to ca. 170 K, T(5OH)· readily converts to the 6-hydroxythymin-5-yl radical, T(6OH)·. One-electron oxidation of N3-methyl-thymidine (N3-Me-dThd) by Cl(2)(•-) at ca. 155 K produces the cation radical (N3-Me-dThd(•+)) for which we find a pH dependent competition between deprotonation from the methyl group at C5 and addition of OH(-) to C5. At pH 7, the 5-methyl deprotonated species is found; however, at pH ca. 9, N3-Me-dThd(•+) produces T(5OH)· that on annealing up to 180 K forms T(6OH)·. Through use of deuterium substitution at C5' and on the thymine base, that is, specifically employing [5',5"-D,D]-5'-dThd, [5',5"-D,D]-5'-TMP, [CD(3)]-dThd and [CD(3),6D]-dThd, we find unequivocal evidence for T(5OH)· formation and its conversion to T(6OH)·. The addition of OH(-) to the C5 position in T(-H)· and N3-Me-dThd(•+) is governed by spin and charge localization. DFT calculations predict that the conversion of the "reducing" T(5OH)· to the "oxidizing" T(6OH)· occurs by a unimolecular OH group transfer from C5 to C6 in the thymine base. The T(5OH)· to T(6OH)· conversion is found to occur more readily for deprotonated dThd and its nucleotides than for N3-Me-dThd. In agreement, calculations predict that the deprotonated thymine base has a lower energy barrier (ca. 6 kcal/mol) for OH transfer than its corresponding N3-protonated thymine base (14 kcal/mol).


Figures

Figure 1
Figure 1
ESR spectrum of T(−H)• formed via annealing at 155 – 160 K after one-electron oxidation of the thymine base by Cl2 in aqueous glassy sample of (A) unlabeled 5'-TMP, green color, and of (B) 15N labeled 5'-TMP, red color. The simulated spectra (blue) (for simulation parameters, see text) are superimposed on the top of the each experimentally recorded spectrum.
Figure 2
Figure 2
ESR spectra of (A) γ-irradiated glassy sample of 5'-TMP (0.5 mg/ml in 7.5 M LiCl/D2O) in the presence of electron scavenger K2S2O8 at pH ca. 12 (black); partial spectrum (brown, 220 G scan) of a pure Cl2 spectrum is overlapped on the black spectrum in A to show the Cl2• line components in the black spectrum. (B–D) Spectra (black) found after annealing to (B) 155 K for 15 min, (C) 160 K for 15 min, (D) 175 K for 20 min. The spectrum of T(−H)• (green, Figure 1A) is overlapped on spectrum (B). The red spectrum in (D) is the simulated spectrum of T(6OH)• which is a mixture of T(6OH)• with β C6-H HFCC of 9 G (80%) and with β C6-H HFCC of 45 G (20%). See text and supporting information Figure S2 for details of simulation. (E) The black spectrum, assigned to T(5OH)•, is obtained by 30% subtraction of spectrum (D) from spectrum (C). All spectra are recorded at 77 K.
Figure 3
Figure 3
ESR spectra of (A) γ-irradiated glassy sample of N3-Me-dThd (2.5 mg/ml in 7.5 M LiCl/D2O) in the presence of electron scavenger K2S2O8 at pH ca. 9 and annealed to 155 K for 15 min. This spectrum is assigned to chiefly N3-Me-dThd•+ (see supporting information Figure S17). (B) 160 K for 15 min, (C) 165 K for 15 min (the central doublet is assigned to T(5OH)•), (D) 170 K for 15 min. (E) 180 K for 15 min. This spectrum is predominantly due to T(6OH)• with C6-H axial conformation (scheme 4) along with a small (ca. 15%) central doublet due to T(5OH)•.
Figure 4
Figure 4
ESR spectra of (A) γ-irradiated glassy sample of N3-Me-dThd (2.5 mg/ml in 7.5 M LiCl/D2O) in the presence of electron scavenger K2S2O8 at pH ca. 12 and annealed to 155 K for 15 min and the central doublet is assigned to T(5OH)•. (B) 160 K for 15 min, (C) 165 K for 15 min, (D) 170 K for 15 min. (E) 180 K for 15 min. This spectrum is assigned to T(6OH)• in the C6-H axial conformation (scheme 4). The red spectrum is the simulated spectrum of T(6OH)• using HFCC values of each of the 3 β methyl protons (19 G) with β C6-H HFCC of 33 G, linewidth 8 G, and g = 2.0035.
Figure 5
Figure 5
ESR spectra of (A) γ-irradiated glassy sample of N3-Me-dThd (2.5 mg/ml in 7.5 M LiCl/D2O) in the presence of electron scavenger K2S2O8 at pH ca. 12 and annealed to 155 K for 15 min showing line components due to Cl2, and UCH2• with some T(6OH)•. (B) After annealing at 160 K for 15 min showing 70% UCH2• and 30% T(6OH)•.
Figure 6
Figure 6
ESR spectra obtained from dThd (black), [5',5”-D,D]-dThd (pink), [CD3]-dThd (thick sky blue), and [CD3,6D]-dThd (blue). These samples were prepared identically [concentration = 2 to 3 mg/ml, in the presence of the electron scavenger K2S2O8 at pH ca. 12], γ-irradiated to a dose of 1.4 kGy. (A) Spectra of T(5OH)• obtained via annealing to 155 K for 15 min. (B) Spectra of T(6OH)• obtained after annealing each sample to 170 K for 15 min.
Figure 7
Figure 7
(A) The experimentally recorded (77 K) T(6OH)• spectrum (thick sky blue, also in Figure 7B) obtained in the glassy (7.5 M LiCl/D2O) sample of [CD3]-dThd sample (3 mg/ml) in the presence of the electron scavenger K2S2O8 at pH ca. 12, γ-irradiated to a dose of 1.4 kGy and progressively annealed to 170 K for 15 min. (B) Spectrum T(6OH)• (green) due to addition of 60% of spectrum (C) to 40% of spectrum (D). (C) Simulated T(6OH)• spectrum (red) using the parameters: HFCC values of 3 methyl deuterons 3.2 G and of C6-H 9 G, g = 2.0035 along with a mixed Lorentzian/Gaussian (1/1) linewidth of 6 G. These couplings are those expected from Table 1 and are unresolved. They only affect the lineshape. (D) Simulated T(6OH)• spectrum (violet) using the parameters: HFCC values of 3 methyl deuterons 3.2 G and of C6-H 39 G, g = 2.0035 along with a mixed Lorentzian/Gaussian (1/1) linewidth of 8 G. Here only the 39 G coupling is resolved.
Figure 8
Figure 8
Dependence of 5'-TMP concentration in mg/ml on the type of conformer (C6-H axial or C6-H equatorial) of T(6OH)• formation via annealing at 175 K. ESR spectra of one-electron oxidized 5'-TMP (A) 5'-TMP (0.5 mg/ml). This spectrum is shown in Figure 2D in the manuscript, (B) 5'-TMP (3 mg/ml). (C) 5'-TMP (10 mg/ml) and this spectrum is shown in Figure S3D.
Figure 9
Figure 9
ESR spectra of T(5OH)• (the central anisotropic doublet) isolated from glassy sample of (A) 3',5'-cTMP (Pink) and (B) T-3',5'-BP (blue). Both these samples were prepared identically [concentration =3 mg/ml, in the presence of the electron scavenger K2S2O8 at pH ca. 12], γ-irradiated to a dose of 1.4 kGy, and annealed to 160 K for 15 min. ESR spectra of T(6OH)• in (C) 3',5'-cTMP (Pink) sample was annealed to 170 K for 15 min, and in (D) T-3',5'-BP sample annealed to 175 K for 15 min (Blue). The spectra obtained using 2',3'-dd-5'-TTP samples are found to be very similar to spectra (A) to (D) and hence are not shown here.
Figure 10
Figure 10
The optimized structure with spin densities and distribution of charge in T(−H)• of dThd calculated at the B3LYP/6-311++G**//B3LYP/6-31G* level in the gas phase. Red color region represents negative charge whereas the blue color region represents positive charge distributions. The radical has considerable charge separation and is near zwitterionic in nature.
Figure 11
Figure 11
B3LYP/6-31G** calculated potential energy surface for the OH transfer from C5 atom to the C6 atom in the thymine base of hydrated T(5OH)• with respect to the change of dihedral angle Φ (C5-C4-C6-C5') of thymine ring. The structures at the beginning (ca. -32°) and end (ca. 16°) are fully optimized. The up and down arrows at C5 show the movement of C5 atom with respect to C4, C6, and C5' atoms. The energies (kcal/mol) were calculated in gas phase (formula image) and in PCM (formula image). The variation of spin density distribution along the PES is also shown at some chosen points (see supporting information Table T1).
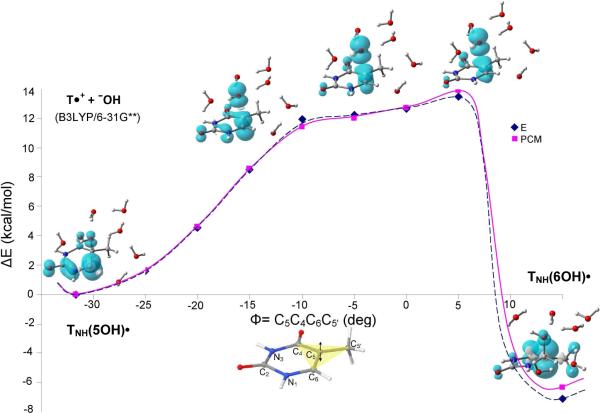
Figure 12
Figure 12
B3LYP/6-31G** calculated potential energy surface for the OH transfer from C5 to C6 atoms of hydrated TNH(5OH)• with respect to the change of dihedral angle Φ (C5-C4-C6-C5') of thymine ring. The structures at the beginning (ca.-32°) and end (ca. 15°) are fully optimized. The up and down arrows at C5 show the movement of C5 atom with respect to C4, C6, and C5' atoms. The energies (kcal/mol) were calculated in the gas phase (formula image) and in PCM (formula image). The variation of spin density distribution along the PES is also shown at some chosen points, for details see supporting information Table T1.
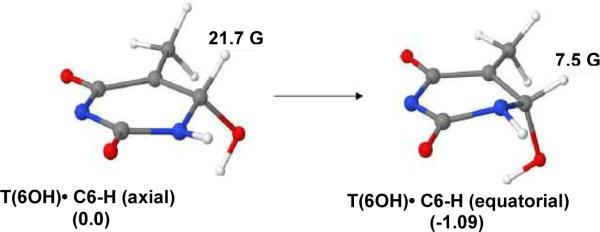
Figure 13
Figure 13
B3LYP/6-31G** fully optimized conformations of T(6OH)• (C6-H axial) and T(6OH)• (C6-H equatorial) in the gas phase with thymine base deprotonated at N3. The relative stabilities of the two conformers of T(6OH)• in kcal/mol are provided in parenthesis.
Scheme 1
Scheme 1
The electrophilic addition and H-atom abstraction reactions of •OH with Thy and its derivatives and the addition of water or OH to the one-electron oxidized Thy and its derivatives reported in the literature are summarized in this scheme.
Scheme 2
Scheme 2
The structures of the thymine base radicals used in this work. The atom numbering scheme is shown here. Representative structural formula of the adduct radical (T(5OH)•) formed via addition of OH/ OD at C5 in T(−H)• and that of T(6OH)• formed via reorganization of T(5OH)• are presented in this scheme.
Scheme 3
Scheme 3
(A) Formation of T(−H)• via one-electron oxidation of N3-deprotonated thymine anion in dThd (R' = 2'-deoxyribose) and its various derivatives (e.g., L-dThd, α-dThd) and nucleotides (e.g., for 5'-TMP, R' = 2'-deoxyribose-5'-phosphate). (B) The production of N3-Me-dThd•+ by one-electron oxidation of N3-Me-dThd.
Scheme 4
Scheme 4
Addition of OH to C5 of T(−H)• yields T(5OH)• (5R and/or 5S). Subsequently, T(5OH)• is converted to various diastereomers of T(6OH)•. The R and S steroisomers of T(6OH)• can not be distinguished by ESR spectroscopy and only the axial and equatorial conformers can be distinguished on the basis of β C6-H HFCC values whereas for T(5OH)• only C6αH hyperfine coupling is experimentally observable and it is same (ca. 20 G) for R or S.

References

    1. von Sonntag C. Free-radical-induced DNA Damage and Its Repair. Springer-Verlag; Berlin, Heidelberg: 2006. pp. 222–227.
    1. von Sonntag C. Adv. Quantum Chem. 2007;52:5–20.
    1. Myers LS, Jr., Hollis LM, Theard LM, Peterson FC, Warnick A. J. Am. Chem. Soc. 1970;92:2875–2882. - PubMed
    1. Fujita S, Steenken S. J. Am. Chem. Soc. 1981;103:2540–2545.
    1. Al-Sheikhly M, von Sonntag C. Z. Naturforsch. 1983;38b:1622–1629.

Publication types

LinkOut - more resources