

The simultaneous role of an alveolus as flow mixer and flow feeder for the deposition of inhaled submicron particles
- PMID: 23363203
- PMCID: PMC5413130
- DOI: 10.1115/1.4007949
The simultaneous role of an alveolus as flow mixer and flow feeder for the deposition of inhaled submicron particles
Abstract
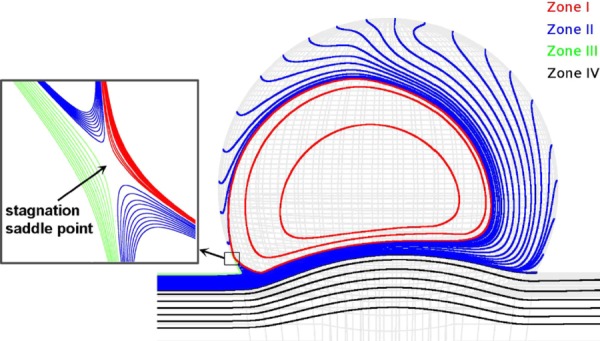
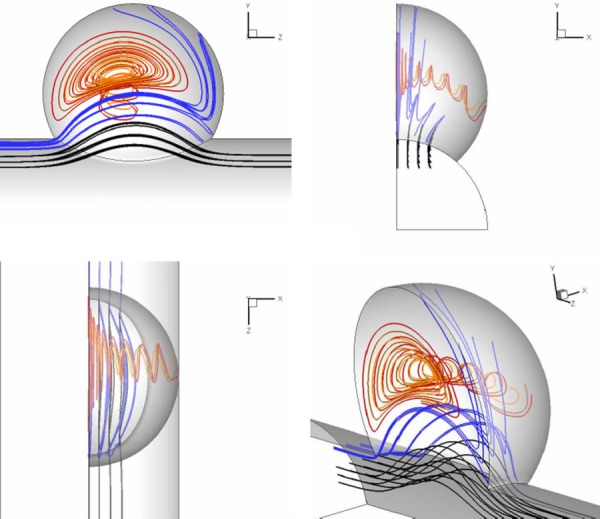
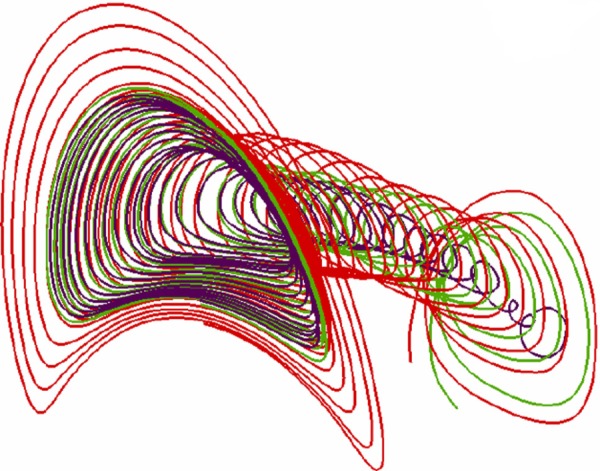
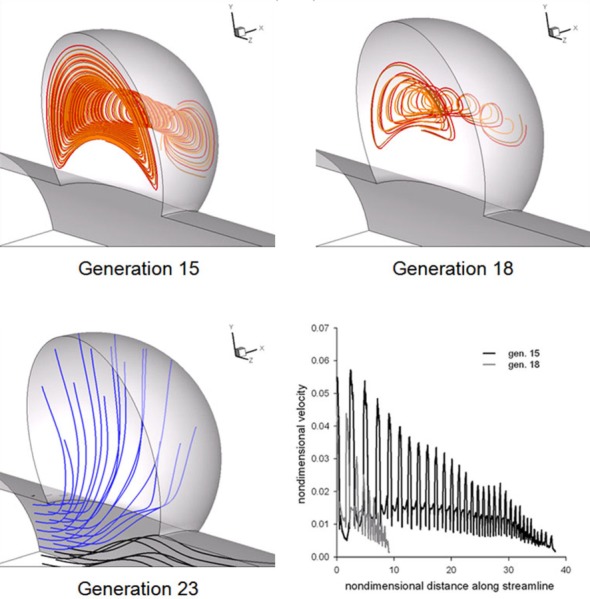
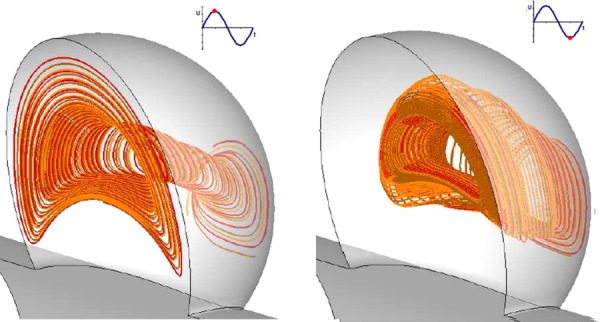
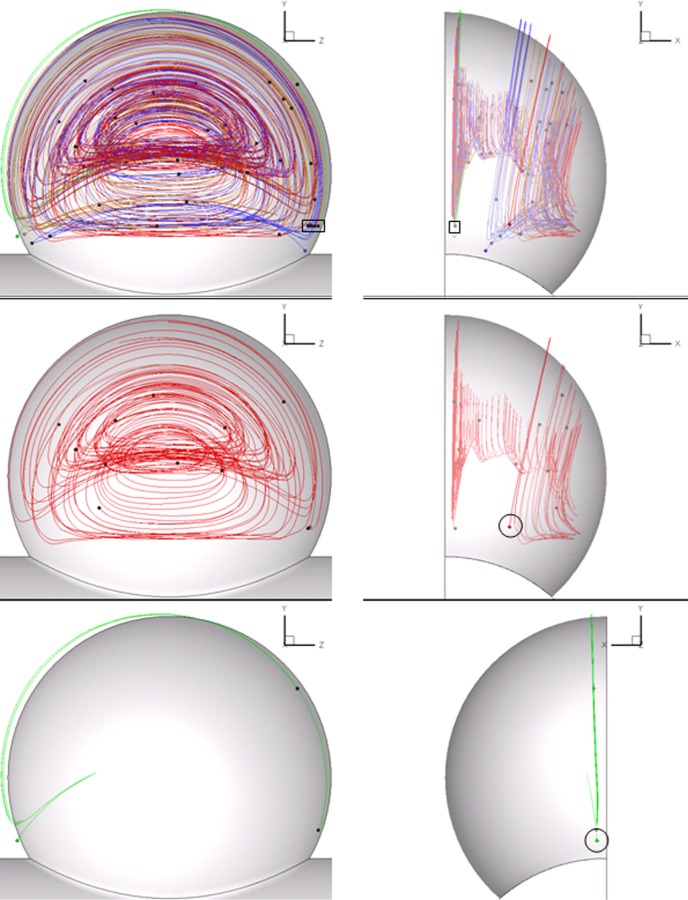
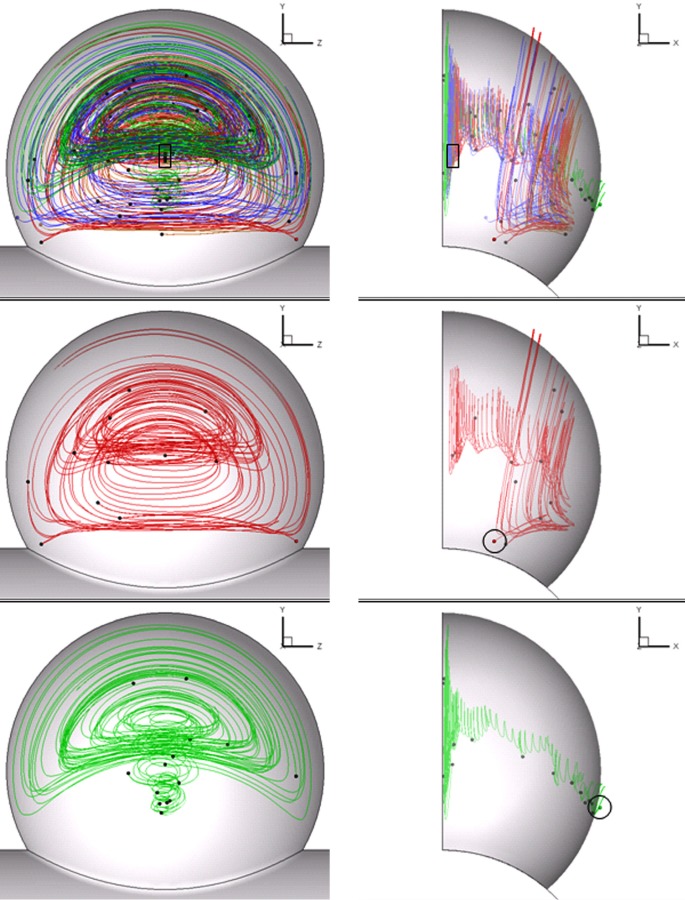
In an effort to understand the fate of inhaled submicron particles in the small sacs, or alveoli, comprising the gas-exchange region of the lung, we calculated the flow in three-dimensional (3D) rhythmically expanding models of alveolated ducts. Since convection toward the alveolar walls is a precursor to particle deposition, it was the goal of this paper to investigate the streamline maps' dependence upon alveoli location along the acinar tree. On the alveolar midplane, the recirculating flow pattern exhibited closed streamlines with a stagnation saddle point. Off the midplane we found no closed streamlines but nested, funnel-like, spiral, structures (reminiscent of Russian nesting dolls) that were directed towards the expanding walls in inspiration, and away from the contracting walls in expiration. These nested, funnel-like, structures were surrounded by air that flowed into the cavity from the central channel over inspiration and flowed from the cavity to the central channel over expiration. We also found that fluid particle tracks exhibited similar nested funnel-like spiral structures. We conclude that these unique alveolar flow structures may be of importance in enhancing deposition. In addition, due to inertia, the nested, funnel-like, structures change shape and position slightly during a breathing cycle, resulting in flow mixing. Also, each inspiration feeds a fresh supply of particle-laden air from the central channel to the region surrounding the mixing region. Thus, this combination of flow mixer and flow feeder makes each individual alveolus an effective mixing unit, which is likely to play an important role in determining the overall efficiency of convective mixing in the acinus.
Figures
Similar articles
-
Respiratory flow phenomena and gravitational deposition in a three-dimensional space-filling model of the pulmonary acinar tree.J Biomech Eng. 2009 Mar;131(3):031010. doi: 10.1115/1.3049481. J Biomech Eng. 2009. PMID: 19154069
-
Gravitational deposition in a rhythmically expanding and contracting alveolus.J Appl Physiol (1985). 2003 Aug;95(2):657-71. doi: 10.1152/japplphysiol.00770.2002. Epub 2003 Mar 14. J Appl Physiol (1985). 2003. PMID: 12639848
-
Modeling Airflow and Particle Deposition in a Human Acinar Region.Comput Math Methods Med. 2019 Jan 14;2019:5952941. doi: 10.1155/2019/5952941. eCollection 2019. Comput Math Methods Med. 2019. PMID: 30755779 Free PMC article.
-
[Progress on numerical simulation of the deposition of inhaled particles in human pulmonary acinus region].Sheng Wu Yi Xue Gong Cheng Xue Za Zhi. 2019 Jun 25;36(3):499-503. doi: 10.7507/1001-5515.201808001. Sheng Wu Yi Xue Gong Cheng Xue Za Zhi. 2019. PMID: 31232555 Free PMC article. Review. Chinese.
-
Aerosol transport and deposition in the rhythmically expanding pulmonary acinus.J Aerosol Med. 1996;9(3):389-408. doi: 10.1089/jam.1996.9.389. J Aerosol Med. 1996. PMID: 10163663 Review.
Cited by
-
Recent advances in the understanding of alveolar flow.Biomicrofluidics. 2022 Apr 13;16(2):021502. doi: 10.1063/5.0084415. eCollection 2022 Mar. Biomicrofluidics. 2022. PMID: 35464135 Free PMC article. Review.
-
How high resolution 3-dimensional imaging changes our understanding of postnatal lung development.Histochem Cell Biol. 2018 Dec;150(6):677-691. doi: 10.1007/s00418-018-1749-7. Epub 2018 Nov 2. Histochem Cell Biol. 2018. PMID: 30390117 Free PMC article. Review.
-
Pulmonary acini exhibit complex changes during postnatal rat lung development.PLoS One. 2021 Nov 8;16(11):e0257349. doi: 10.1371/journal.pone.0257349. eCollection 2021. PLoS One. 2021. PMID: 34748555 Free PMC article.
-
Microflows in two-generation alveolar cells at an acinar bifurcation.Biomicrofluidics. 2022 Sep 6;16(5):054101. doi: 10.1063/5.0098302. eCollection 2022 Sep. Biomicrofluidics. 2022. PMID: 36097514 Free PMC article.
-
Particle dynamics and deposition in true-scale pulmonary acinar models.Sci Rep. 2015 Sep 11;5:14071. doi: 10.1038/srep14071. Sci Rep. 2015. PMID: 26358580 Free PMC article.
References
-
- ICRP Publication 66, 1994, “Human Respiratory Tract Model for Radiological Protection,” A report of a Task Group of the International Commission on Radiological Protection, Ann. ICRP, 24(1–3), pp. 1–482. - PubMed
-
- Tsuda, A. , Otani, Y. , and Butler, J. P. , 1999, “Acinar Flow Irreversibility Caused by Boundary Perturbation of Reversible Alveolar Wall Motion,” J. Appl. Physiol., 86(3), pp. 977–984. - PubMed
-
- Tippe, A. , and Tsuda, A. , 2000, “Recirculating Flow in an Expanding Alveolar Model: Experimental Evidence of Flow-Induced Mixing of Aerosols in the Pulmonary Acinus,” J. Aerosol Sci., 31(8), pp. 979–986.10.1016/S0021-8502(99)00572-8 - DOI
Publication types
MeSH terms
Grants and funding
LinkOut - more resources
Full Text Sources
Miscellaneous
