

Accurate scoring of the apnea-hypopnea index using a simple non-contact breathing sensor
- PMID: 23363404
- PMCID: PMC3641178
- DOI: 10.1111/jsr.12023
Accurate scoring of the apnea-hypopnea index using a simple non-contact breathing sensor
Abstract
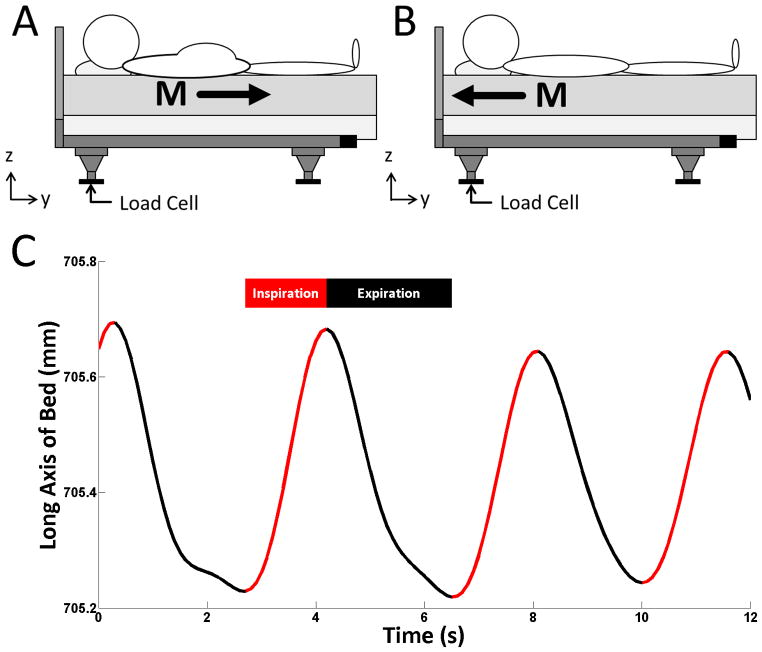
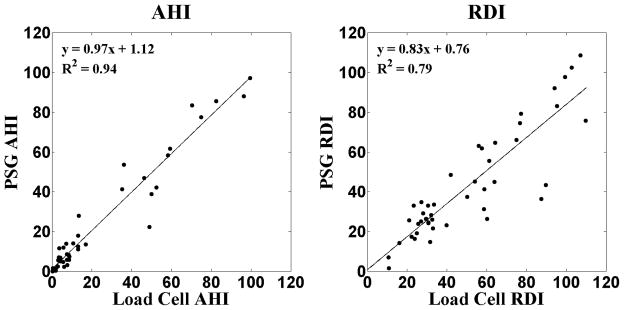
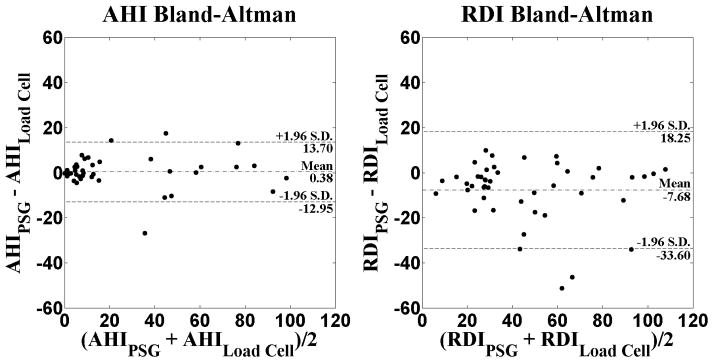
Sleep apnea is a serious condition that afflicts many individuals and is associated with serious health complications. Polysomnography, the gold standard for assessing and diagnosing sleep apnea, uses breathing sensors that are intrusive and can disrupt the patient's sleep during the overnight testing. We investigated the use of breathing signals derived from non-contact force sensors (i.e. load cells) placed under the supports of the bed as an alternative to traditional polysomnography breathing sensors (e.g. nasal pressure, oral-nasal thermistor, chest belt and abdominal belt). The apnea-hypopnea index estimated using the load cells was not different than that estimated using standard polysomnography leads (t44 = 0.37, P = 0.71). Overnight polysomnography sleep studies scored using load cell breathing signals had an intra-class correlation coefficient of 0.97 for the apnea-hypopnea index and an intra-class correlation coefficient of 0.85 for the respiratory disturbance index when compared with scoring using traditional polysomnography breathing sensors following American Academy of Sleep Medicine guidelines. These results demonstrate the feasibility of using unobtrusive load cells installed under the bed to measure the apnea-hypopnea index.
© 2013 European Sleep Research Society.
Conflict of interest statement
No conflict of interest exists for any author.
Figures
Similar articles
-
Rules for scoring respiratory events in sleep: update of the 2007 AASM Manual for the Scoring of Sleep and Associated Events. Deliberations of the Sleep Apnea Definitions Task Force of the American Academy of Sleep Medicine.J Clin Sleep Med. 2012 Oct 15;8(5):597-619. doi: 10.5664/jcsm.2172. J Clin Sleep Med. 2012. PMID: 23066376 Free PMC article.
-
The use of combined thermal/pressure polyvinylidene fluoride film airflow sensor in polysomnography.Sleep Breath. 2013 Dec;17(4):1267-73. doi: 10.1007/s11325-013-0832-5. Epub 2013 May 29. Sleep Breath. 2013. PMID: 23716021
-
Validation of a Textile-Based Wearable Measuring Electrocardiogram and Breathing Frequency for Sleep Apnea Monitoring.Sensors (Basel). 2024 Sep 26;24(19):6229. doi: 10.3390/s24196229. Sensors (Basel). 2024. PMID: 39409269 Free PMC article.
-
The scoring of respiratory events in sleep: reliability and validity.J Clin Sleep Med. 2007 Mar 15;3(2):169-200. J Clin Sleep Med. 2007. PMID: 17557426 Review.
-
Sleep apnea.Curr Opin Pulm Med. 2000 Nov;6(6):479-84. doi: 10.1097/00063198-200011000-00003. Curr Opin Pulm Med. 2000. PMID: 11100956 Review.
Cited by
-
Estimation of the respiratory rate from ballistocardiograms using the Hilbert transform.Biomed Eng Online. 2022 Aug 4;21(1):54. doi: 10.1186/s12938-022-01024-4. Biomed Eng Online. 2022. PMID: 35927665 Free PMC article.
-
Digital Health and Sleep-Disordered Breathing: A Systematic Review and Meta-Analysis.J Clin Sleep Med. 2018 Sep 15;14(9):1605-1620. doi: 10.5664/jcsm.7346. J Clin Sleep Med. 2018. PMID: 30176971 Free PMC article.
-
Automatic Video Analysis for Obstructive Sleep Apnea Diagnosis.Sleep. 2016 Aug 1;39(8):1507-15. doi: 10.5665/sleep.6008. Sleep. 2016. PMID: 27253769 Free PMC article.
-
Validating Force Sensitive Resistor Strip Sensors for Cardiorespiratory Measurement during Sleep: A Preliminary Study.Sensors (Basel). 2023 Apr 13;23(8):3973. doi: 10.3390/s23083973. Sensors (Basel). 2023. PMID: 37112315 Free PMC article.
-
Diagnostic Modalities in Sleep Disordered Breathing: Current and Emerging Technology and Its Potential to Transform Diagnostics.Respirology. 2025 Apr;30(4):286-302. doi: 10.1111/resp.70012. Epub 2025 Mar 3. Respirology. 2025. PMID: 40032579 Free PMC article. Review.
References
-
- Agnew HW, Jr, Webb WB, Williams RL. The first night effect: an EEG study of sleep. Psychophysiology. 1966;2:263–6. - PubMed
-
- Alihanka J, Vaahtoranta K, Saarikivi I. A new method for long-term monitoring of the ballistocardiogram, heart rate, and respiration. Am J Physiol. 1981;240:R384–92. - PubMed
-
- Baldwin CM, Griffith KA, Nieto FJ, O’connor GT, Walsleben JA, Redline S. The association of sleep-disordered breathing and sleep symptoms with quality of life in the Sleep Heart Health Study. Sleep. 2001;24:96–105. - PubMed
Publication types
MeSH terms
Grants and funding
LinkOut - more resources
Full Text Sources
Other Literature Sources
Medical
