. 2013 Mar;24(6):768-84.
doi: 10.1091/mbc.E12-06-0488. Epub 2013 Jan 30.

Intermediate filament-associated cytolinker plectin 1c destabilizes microtubules in keratinocytes

Affiliations

Intermediate filament-associated cytolinker plectin 1c destabilizes microtubules in keratinocytes

Rocio G Valencia et al. Mol Biol Cell. 2013 Mar.

Abstract

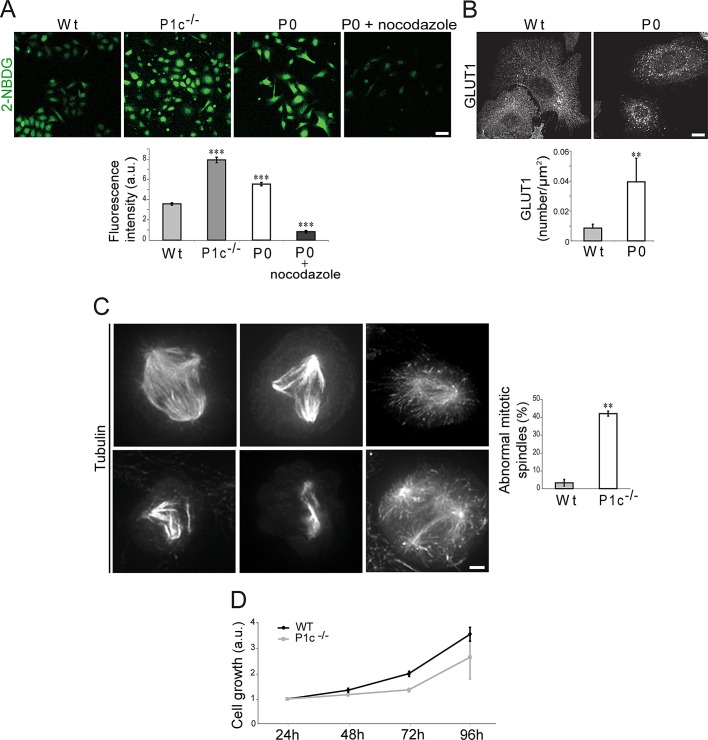
The transition of microtubules (MTs) from an assembled to a disassembled state plays an essential role in several cellular functions. While MT dynamics are often linked to those of actin filaments, little is known about whether intermediate filaments (IFs) have an influence on MT dynamics. We show here that plectin 1c (P1c), one of the multiple isoforms of the IF-associated cytolinker protein plectin, acts as an MT destabilizer. We found that MTs in P1c-deficient (P1c(-/-)) keratinocytes are more resistant toward nocodazole-induced disassembly and display increased acetylation. In addition, live imaging of MTs in P1c(-/-), as well as in plectin-null, cells revealed decreased MT dynamics. Increased MT stability due to P1c deficiency led to changes in cell shape, increased velocity but loss of directionality of migration, smaller-sized focal adhesions, higher glucose uptake, and mitotic spindle aberrations combined with reduced growth rates of cells. On the basis of ex vivo and in vitro experimental approaches, we suggest a mechanism for MT destabilization in which isoform-specific binding of P1c to MTs antagonizes the MT-stabilizing and assembly-promoting function of MT-associated proteins through an inhibitory function exerted by plectin's SH3 domain. Our results open new perspectives on cytolinker-coordinated IF-MT interaction and its physiological significance.


Figures

FIGURE 1:
FIGURE 1:
P1c interacts with MTs and affects MT cytoarchitecture. (A) IFM of undifferentiated (0.05 mM Ca2+) and stratifying (1.8 mM Ca2+) immortalized wild-type (left column), immortalized P0 keratinocytes (middle column), and primary P1c−/− (right column) keratinocytes, using antibodies to tubulin. Note higher density of MT bundles, particularly in peripheral regions, in differentiated P0 and P1c−/− compared with wild-type cells. Scale bar: 20 μm. (B) Double IFM of immortalized wild-type keratinocytes using anti–α-tubulin and anti–isoform P1c–specific antibodies. Note immunolocalization of P1c all over the cytoplasm (survey) and P1c dotted decoration of MTs (detail). Scale bars: 50 μm (top row); 10 μm (bottom row).
FIGURE 2:
FIGURE 2:
P1c affects the stability of keratinocyte MTs. (A) Nocodazole-treated primary wild-type, P1c−/−, and P0 keratinocytes were immunolabeled using antibodies to α-tubulin (tubulin), and drug-resistant MTs remaining in cells were traced (MT-tracing) and quantified (n = 5; 20 cells/experiment). (B) The proportions of acetylated (green) MTs present in primary keratinocytes of the types indicated, were analyzed using rat mAbs to tubulin and mouse mAbs to acetylated tubulin. Statistical evaluations as in (A). (A and B) Scale bars: 20 μm. Error bars: ± 95% confidence interval (CI). *, p < 0.05; **, p < 0.01; ***, p < 0.001. (C) Quantification (IB) of acetylated tubulin present in cell lysates from immortalized wild-type and P0 keratinocytes prior to (0.05 mM Ca2+) and after exposure (3 h) to 1.8 mM Ca2+. Numbers are quantified relative levels of acetylated tubulin.
FIGURE 3:
FIGURE 3:
P1c variants lacking the IF-binding domain fail to reverse MT stabilization in P1c-deficient keratinocytes. (A) Nocodazole-treated primary P1c−/− keratinocytes transfected with full-length P1c-EGFP (top row), P1c8-EGFP (middle row), and P1c-30-EGFP (bottom row) were immunolabeled using antibodies to α-tubulin (tubulin) and drug-resistant MTs remaining in cells were traced (MT tracing). Bar graph shows quantification of the MT length normalized to total cell area; red and black broken lines indicate corresponding values measured for wild-type and P1c−/− cells, respectively (see Figure 2A) (n = 3; 6 cells/experiment). Error bars: ± 95% CI. *, p < 0.05; ***, p < 0.001. Scale bar: 15 μm. (B) The proportion of acetylated tubulin present in primary P1c−/− keratinocytes expressing full-length or truncated versions of P1c (see A) was determined by IFM, as described in Figure 2B. Channels: red, tubulin; green, acetylated tubulin; blue, EGFP. Scale bars: 15 μm (top row); 10 μm (middle and bottom rows). Bar graph represents statistical evaluations as in (A).
FIGURE 4:
FIGURE 4:
P1c affects dynamic properties of MTs. (A) Images taken from a time-lapse recording (Video S1) of immortalized wild-type and P0 keratinocytes transfected with EGFP-tubulin and outlining (MT-tracing) of representative MTs. MTs outlined in red and black denote two examples of shrinking MTs in a wild-type cell, while lines in blue represent MTs in a P0 cell that failed to undergo catastrophe after reaching the membrane. Scale bar: 5 μm. (B) Bar graphs showing analyses of rescue and catastrophe frequencies (n = 3; >10 cells/experiment). Error bars: ± 95% CI. *, p < 0.05. (C) Graph represents proportions (%) of MTs in wild-type vs. P0 cells that were growing perpendicularly toward the plasma membrane (without bending) or bending and/or sliding along the membrane (n = 3; 10 cells/experiment). Error bars: ± 95% CI. ***, p < 0.001. (D) Bar graph representing the pausing times of EB1 comets measured in wild-type, P0, and P1c−/− keratinocytes normalized to the total time of MT growth recorded. Error bars: ± SEM. ***, p < 0.001. (E) Time-lapse images (Video S5) of selected single EB1 comets continuously growing (without pausing) between time points measured; representative examples for wild-type, P0, and P1c−/− cells are shown. Note faster growth of EB1 comets (corresponding to growing tips of MTs) in both types of mutant cells (red and yellow arrowheads) compared with their wild-type counterpart (white arrowheads) over the same time period. Scale bar: ∼3 μm. Graph shows analysis of MT growth rates (n = 3; ∼20 cells/experiment). Error bars: ± 95% CI. ***, p < 0.001. (F) Single-frame images taken from time-lapse recordings of GFP-EB1–expressing immortalized wild-type and P0, as well as primary P1c−/− keratinocytes (Videos S6–S8, respectively. Note that Videos S6–S8 show details of Videos S2–S4). Colored lines mark trajectories of different EB1 comets (EB1-tracing). Green broken lines mark cell margins. Colored EB1 traces in wild-type images (top rows) represent individual MTs that grow toward the periphery and disappear after reaching the margin; outlined trajectories in P0 cells (middle rows) mark MTs that continue to grow upon reaching the membrane and either meander (red line) or bend and grow parallel to the membrane (blue and black lines); EB1 traces in P1c−/− images (bottom rows) show MTs that continuously grow along the membrane, and MTs that bend and keep growing after reaching the membrane. Scale bar: 5 μm. Note that a different microscopy setup was used for the imaging of wild-type and P0 cells than for imaging of P1c−/− cells (see Materials and Methods).
FIGURE 5:
FIGURE 5:
Alterations in shape and polarized migration of P1c-deficient keratinocytes. (A) Phase-contrast images of representative primary wild-type, P0, and P1c−/− keratinocytes and migration traces of single cells (monitored by video microscopy) are shown. Scale bar: 100 μm. (B) Bar graphs show statistical analyses of cell area (a), cell perimeter (b), shape factor (c), aspect ratio (d), velocity (e), and directionality (f) of migrating primary wild-type, P1c−/−, and P0 keratinocytes (n = 3; 20 cells/experiment). *, p < 0.05; **, p < 0.005; ***, p < 0.001.
FIGURE 6:
FIGURE 6:
Loss of P1c alters FA dynamics. (A) Images of EGFP-paxillin–expressing immortalized wild-type and P0 and primary P1c−/− keratinocytes. Scale bar: 10 μm. Box-and-whisker plots indicate the median (middle line in the box), 25th percentile (bottom line of the box), 75th percentile (top line of the box), and 2.5th and 97.5th percentiles (whiskers) of FA size values. Graph shows changes in FA size over time (n = 3; 10 cells/experiment). Error bars: ± SEM. (B) Cells as in (A) double immunolabeled using antibodies to paxillin (green) and α-tubulin (red) to distinguish between MT-positive (arrowheads) and MT-negative FAs. Left column shows survey views of wild-type, P1c−/−, and P0 keratinocytes. Scale bar: 10 μm. The three columns on the right show selected views (boxed) in detail. Scale bar: 5 μm. Bar graph: statistical analysis of MT-targeting of FAs in wild-type and mutant keratinocytes evaluated by a chi-square test (n = 3; 10 cells/experiment). *, p < 0.05. Error bars: ± SEM.
FIGURE 7:
FIGURE 7:
Alterations of glucose uptake and mitotic spindle formation in plectin-deficient keratinocytes. (A) Primary wild-type, P1c−/−, P0, and nocodazole-treated P0 keratinocytes were incubated with 2-NBDG, and fluorescence intensities of cells were measured. Data were evaluated as described in the text (n = 3; 200 cells/experiment). ***, p < 0.001. Error bars: ± 95% CI. Scale bar: 1 mm. (B) Quantification of GLUT1 by immunolabeling of keratinocytes using antibodies to GLUT1. Scale bar: 10 μm. Bar graph represents GLUT1 signals normalized to total cell area (n = 3; 10 cells/experiment). **, p < 0.01. Error bars: ± 95% CI. (C) Gallery of abnormal mitotic spindle formations in primary P1c−/− keratinocytes. Spindle apparatuses were visualized by immunolabeling using antibodies to α-tubulin. Scale bar: 10 μm. Bar graph shows evaluation of abnormal mitotic spindles (n = 4; ∼150 cells/experiment). **, p < 0.01. Error bars: ± 95% CI. (D) Growth rates of primary wild-type and P1c−/− keratinocytes measured during 96 h after seeding (n = 3). Error bars: ± SEM.
FIGURE 8:
FIGURE 8:
P1c-MAP interaction and expression of tau and MAP2 in cultured keratinocytes and epidermis. (A) Scheme of N-terminal subdomains, exon allocations, and fragments of plectin used for overlay assays. (B) Overlay assay showing binding of N-terminal plectin fragments to HMW MAPs. Note strongest signal observed with p20-21. Semi-quantitative estimates of MAP-binding affinities obtained by densitometric scanning of gels are indicated in (A). (C) Coimmunoprecipitation of endogenous HMW MAPs with P1c from brain lysates. Note that P1c and HMW MAPs showed cosedimentation when anti-P1c antibodies were used, but not when nonspecific IgGs were used (n = 3). (D) Tau and MAP2-specific cDNA fragments amplified from total RNA contained in cell lysates of primary and immortalized keratinocytes, epidermis, and brain, using RT-PCR (primers are specified in Table S1); brain was used as positive control for tau and MAP2. (E) IFM of frozen foot pad skin sections from adult wild-type mice using antibodies to tau or MAP2. In negative controls, primary antibodies were omitted; nuclei were stained with 4′,6-diamidino-2-phenylindole. Note relatively strong immunofluorescence signals for both antigens in epidermis (e), and weaker signals in hair follicles (asterisk) and in a few scattered cells in the dermis (d). Scale bars: 25 μm.
FIGURE 9:
FIGURE 9:
Plectin's SH3 domain compromises MAP–MT interaction. (A) Inhibition of MAP2c promoted in vitro assembly of MTs by fragment p20-21. MTs were assembled in vitro from purified samples of tubulin and recombinant MAP2c in the presence of fragment p20-21 (at concentrations indicated) and sedimented by centrifugation. Resulting pellet (p) fractions (containing polymerized MTs and MT-bound MAP2c), and supernatant (s) fractions (containing soluble tubulin and unbound MAP2c, as well as p20-21) were analyzed by SDS–PAGE. Coomassie blue–stained gel bands corresponding to MAP2c and tubulin in s and p fractions were quantified (bar graph). Error bars: ± SD (n = 5). (B) Disruption of tau–MT interaction by fragment p20-21. The detachment of endogenous tau from stabilized MTs (contained in brain cell lysates) was measured by SDS–PAGE of sedimented MT fractions after incubation of lysates with p20-21 at concentrations indicated. Coomassie blue–stained protein bands corresponding to MT-bound tau, sedimented tubulin (MT polymers), and neurofilament protein M (NF-M; loading control) are shown. Quantification (graph) as in (A). Error bars: ± SEM (n = 5). (C) Deconvolved IFM images of cytoplasmic regions of primary wild-type, P1c−/−, and P0 keratinocytes using antibodies as indicated. Arrowheads, patches of MAP2 along MTs. Scale bar: 2 μm. Bar graph, percentages of colocalizing tubulin and MAP2 signals. Error bars: ± SEM (n = 3). *, p > 0.05; **, p > 0.01. (D) Model depicting plectin as MT destabilizer. Binding of P1c to MTs presumably occurs via its isoform-specific N-terminal sequence, including the ABD, while the SH3 domain located within the plakin domain binds to MAPs. Interference with the MT-stabilizing function of MAPs ensures a dynamic MT network in wild-type cells. When P1c is absent, more MAPs can bind along MTs, leading to their stabilization.

Similar articles

Cited by

References

    1. Abrahamsberg C, Fuchs P, Osmanagic-Myers S, Fischer I, Propst F, Elbe-Bürger A, Wiche G. Targeted ablation of plectin isoform 1 uncovers role of cytolinker proteins in leukocyte recruitment. Proc Natl Acad Sci USA. 2005;102:18449–18454. - PMC - PubMed
    1. Ackerl R, Walko G, Fuchs P, Fischer I, Schmuth M, Wiche G. Conditional targeting of plectin in prenatal and adult mouse stratified epithelia causes keratinocyte fragility and lesional epidermal barrier defects. J Cell Sci. 2007;120:2435–2443. - PubMed
    1. Akhmanova A, Steinmetz MO. Tracking the ends: a dynamic protein network controls the fate of microtubule tips. Nat Rev Mol Cell Biol. 2008;9:309–322. - PubMed
    1. Andrä K, Kornacker I, Jörgl A, Zörer M, Spazierer D, Fuchs P, Fischer I, Wiche G. Plectin-isoform-specific rescue of hemidesmosomal defects in plectin (–/–) keratinocytes. J Invest Dermatol. 2003;120:189–197. - PubMed
    1. Andrä K, Lassmann H, Bittner R, Shorny S, Fässler R, Propst F, Wiche G. Targeted inactivation of plectin reveals essential function in maintaining the integrity of skin, muscle, and heart cytoarchitecture. Genes Dev. 1997;11:3143–3156. - PMC - PubMed

Publication types

LinkOut - more resources