. 2013 Apr;24(7):945-63.
doi: 10.1091/mbc.E12-10-0736. Epub 2013 Jan 30.

Rap1 and Canoe/afadin are essential for establishment of apical-basal polarity in the Drosophila embryo

Affiliations

Rap1 and Canoe/afadin are essential for establishment of apical-basal polarity in the Drosophila embryo

Wangsun Choi et al. Mol Biol Cell. 2013 Apr.

Abstract

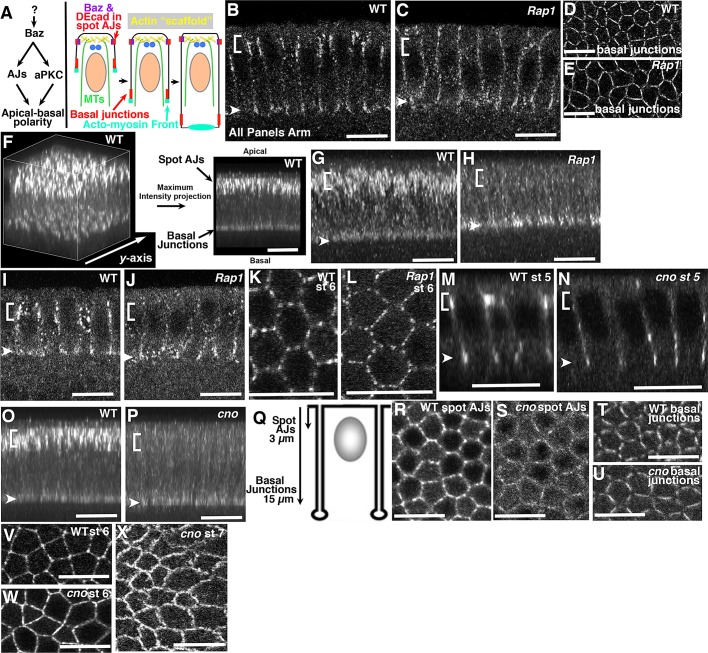
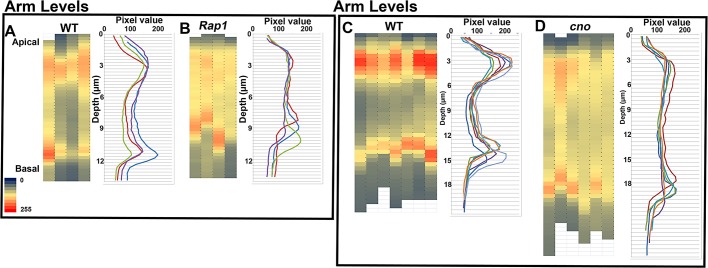
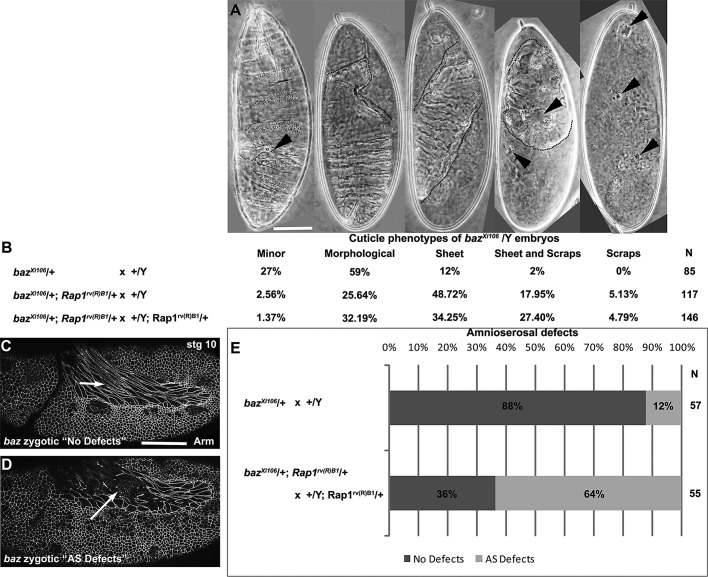
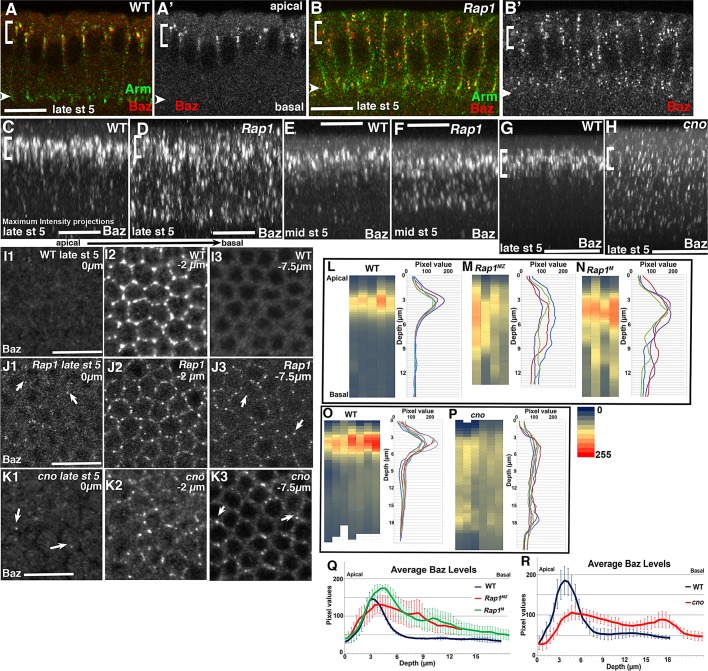
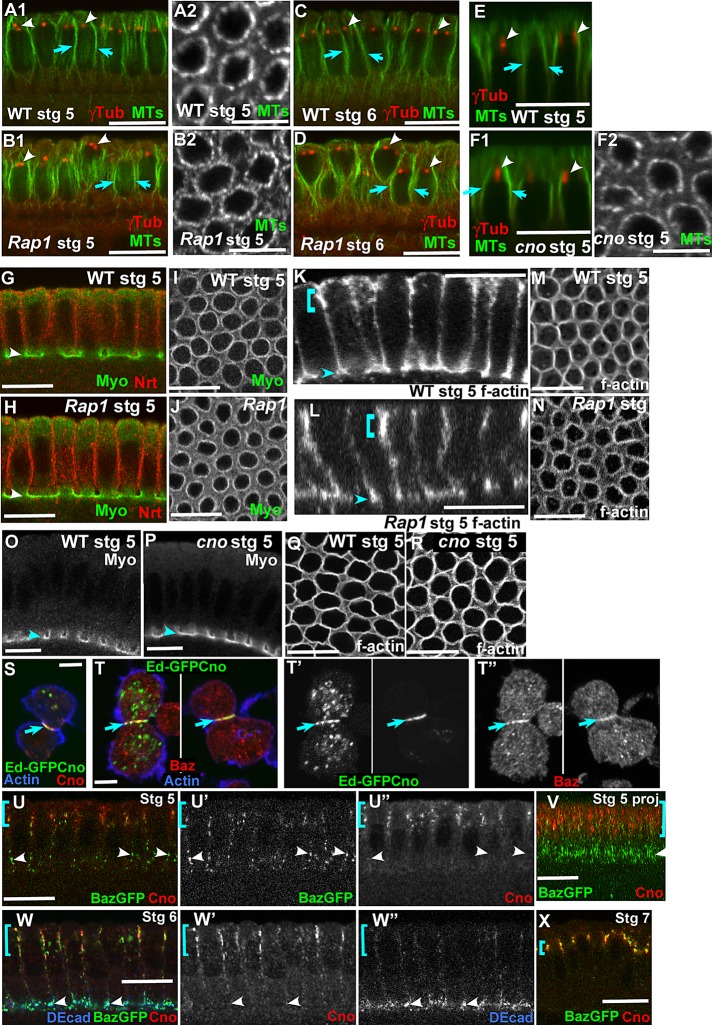
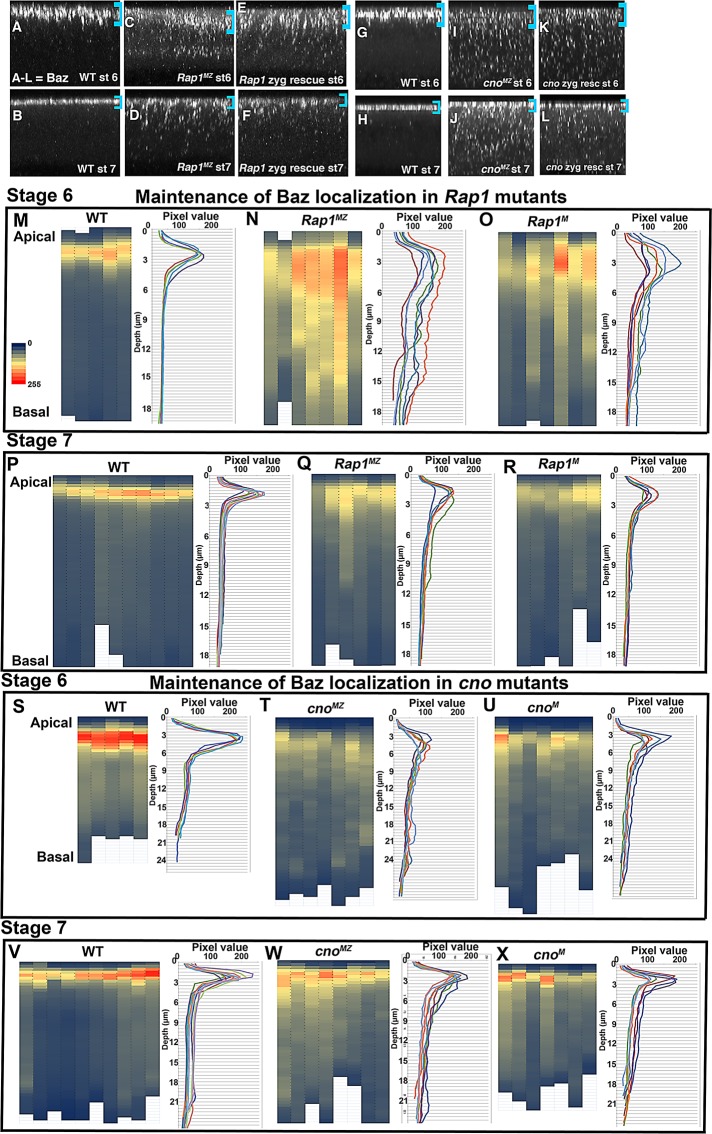
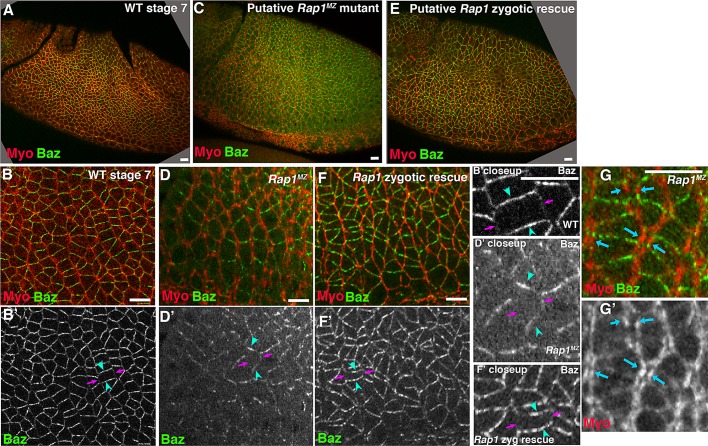
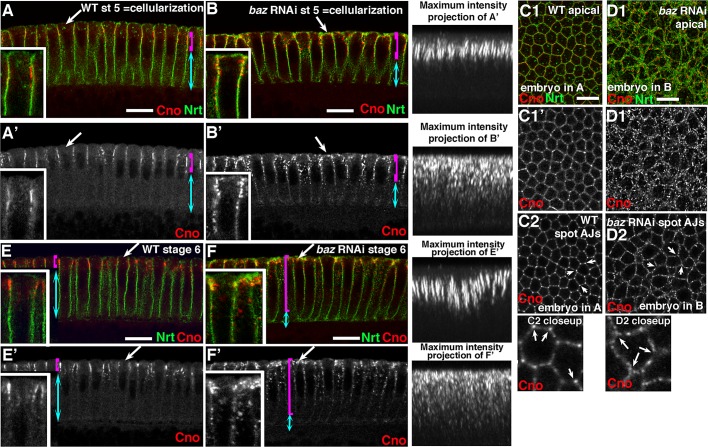
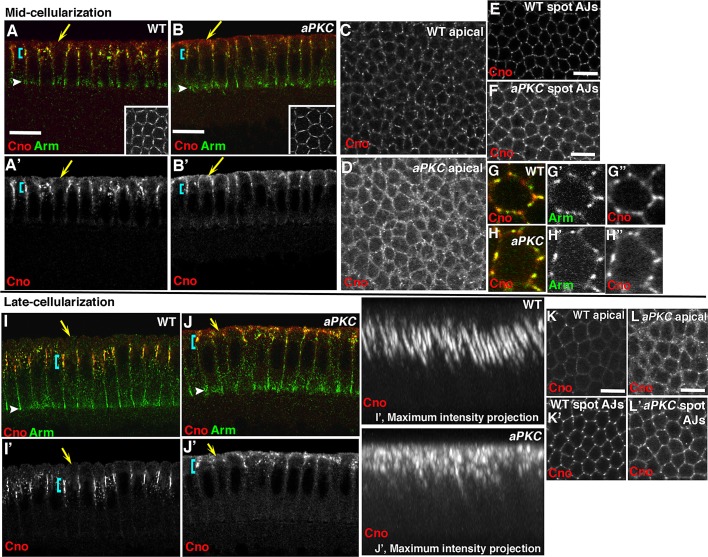
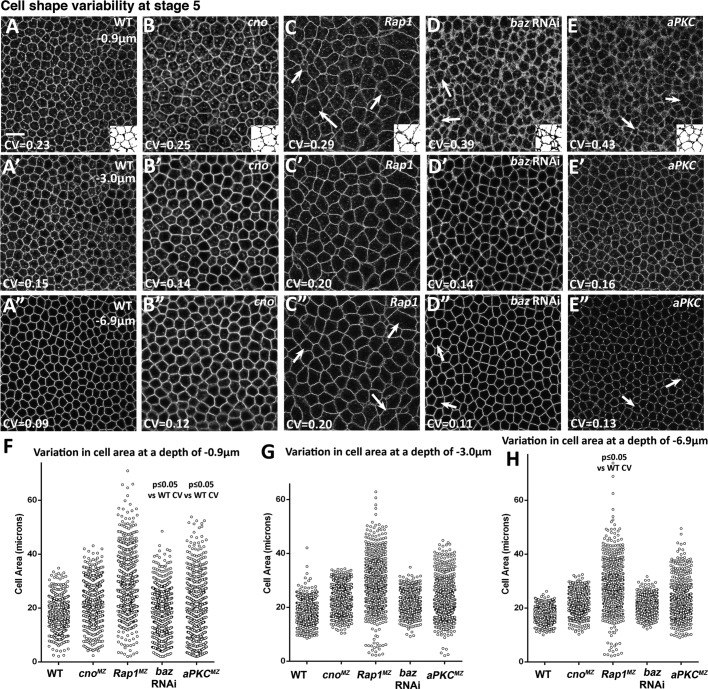
The establishment and maintenance of apical-basal cell polarity is critical for assembling epithelia and maintaining organ architecture. Drosophila embryos provide a superb model. In the current view, apically positioned Bazooka/Par3 is the initial polarity cue as cells form during cellularization. Bazooka then helps to position both adherens junctions and atypical protein kinase C (aPKC). Although a polarized cytoskeleton is critical for Bazooka positioning, proteins mediating this remained unknown. We found that the small GTPase Rap1 and the actin-junctional linker Canoe/afadin are essential for polarity establishment, as both adherens junctions and Bazooka are mispositioned in their absence. Rap1 and Canoe do not simply organize the cytoskeleton, as actin and microtubules become properly polarized in their absence. Canoe can recruit Bazooka when ectopically expressed, but they do not obligatorily colocalize. Rap1 and Canoe play continuing roles in Bazooka localization during gastrulation, but other polarity cues partially restore apical Bazooka in the absence of Rap1 or Canoe. We next tested the current linear model for polarity establishment. Both Bazooka and aPKC regulate Canoe localization despite being "downstream" of Canoe. Further, Rap1, Bazooka, and aPKC, but not Canoe, regulate columnar cell shape. These data reshape our view, suggesting that polarity establishment is regulated by a protein network rather than a linear pathway.


Figures

FIGURE 1:
FIGURE 1:
Rap1 and Cno are required for initial assembly of apical adherens junctions. (A) Diagram of current model of polarity establishment (left) and of initial apical–basal polarization during cellularization (right). (B–X) AJ protein Arm. (A–H) Late cellularization. (B, C) Apical-basal cross-sections. In WT (B), Arm is enriched at nascent apical spot AJs (bracket) and in basal junctions (arrowhead). In contrast, in Rap1 mutants, apical spot AJ enrichment is reduced or lost (C, bracket). (D, E) Basal junctions remain essentially unchanged in Rap1 mutants (D vs. E). (F) Approach for creating projections of cross-sections. Image stacks were collected and maximum-intensity projections created along the y-axis. This makes enrichment at forming apical junctions and basal junctions more readily apparent. (G, H) Projections highlight loss of apical Arm enrichment in Rap1 (H, bracket) vs. WT (G, bracket), whereas basal junction enrichment remains (arrowheads). (I, J) Reduced apical enrichment in Rap1 mutants (J, brackets) is already present at midcellularization. (K, L) Apical views, stage 6 (gastrulation onset). Apical spot AJs are present in both WT (K) and Rap1 mutants (L). (M–T) Late cellularization. (M, N) Single apical–basal cross-sections. (O, P) Projections of apical–basal cross-sections (as in F). Arm is enriched in both spot AJs and basal junctions in WT (M, O, brackets), whereas Arm enrichment in spot AJs is lost in cno mutants (N, P, brackets), although basal junction enrichment remains (arrowheads). (Q) Planes of surface views in R–U. (R, S) The uniform enrichment of spot AJs in WT (R) is reduced in cno mutants (S), whereas basal junctions remain relatively unaltered (T vs. U). (V–X.) Apical spot AJs are visible in stage 6 WT (V) and cno mutants (W), and AJs are present in stage 7 cno mutants (X). Scale bars, 10 μm.
FIGURE 2:
FIGURE 2:
Rap1 and Cno regulate apical positioning of Arm in forming apical junctions. The Plot Profile option in ImageJ was used to measure average image intensity in projected cross-sections, and data were displayed either as heat maps illustrating intensity with different colors (left, apical is on top; each column is a different embryo) or graphically, displaying pixel intensity vs. depth from the apical surface (right, each line is a different embryo). Note that since we use embryos from more than one experiment, these quantitative measures are useful for comparing signal intensity along the apical–basal axis within an embryo, but absolute intensities between embryos vary due to variations in staining and imaging.
FIGURE 3:
FIGURE 3:
Reducing Rap1 levels enhances the effects of reducing Baz function on epithelial integrity. (A) Cuticle preparations illustrating the range of defects in epithelial integrity seen in embryos with reduced Baz levels (zygotic baz mutants; embryos were left inside the vitelline eggshell). These range from nearly WT, with only minor cuticle holes (Minor, arrow), to strong defects in the head (Morphological), to half the cuticle remaining (Sheet), to smaller sheets of intact cuticle (Sheet and Scraps), to only fragments of cuticle remaining (Scraps). (B) All embryos have reduced maternal Baz (mothers are heterozygous). We assessed the phenotype of the ∼25% of embryos that die because they are baz zygotic mutant. Most baz zygotic mutants (top row) have only mild to moderate cuticle defects. Reducing maternal Rap1 levels by 50% (middle) significantly enhances the epithelial defects of baz zygotic mutants. Further reducing Rap1 levels (heterozygous mothers; 25% of progeny are zygotic Rap1 mutant) further enhances the epithelial defects of baz zygotic mutants. (C–E) Analysis of amnioserosal AJ integrity (Arm) in progeny of crosses in B. In the cross generating zygotic baz mutants (E, top) 88% have an intact amnisoserosa at stage 10, whereas 12% of embryos display defects in Arm localization within the amnioserosa as Baz levels run down (C, arrow, vs. D, arrow; E, top). Reducing maternal and zygotic Rap1 substantially enhances the frequency of these defects, with 64% of embryos with amnioserosa defects (E, bottom). Scale bars, 75 μm.
FIGURE 4:
FIGURE 4:
Rap1 and Cno are required for initial apical enrichment of Baz. (A, B) Late cellularization. In WT Baz is restricted to forming apical junctions (A, bracket), whereas in Rap1 mutants apical enrichment is lost (B, bracket) and Baz puncta are all along the lateral border down to the basal junctions (B, arrowheads). (C–H) Maximum-intensity projections along the y-axis of cross-sections. In late cellularization (C, D, G, H), this highlights exclusively apical Baz enrichment in WT (C, G) and reduced apical restriction in Rap1 (D) and cno mutants (H). (E, F) Reduced apical restriction of Baz in Rap1 mutants begins to become apparent by midcellularization. (I–K). Surface sections at different apical–basal depths, as indicated. Note that whereas Baz puncta are relatively tightly localized to apical junctions in WT (I), they are found both apical and basal to this position in Rap (J) or cno mutants (K). Scale bars, 10 μm. (L–P) Quantitative analysis of changes in Baz localization along the apical–basal axis, as in Figure 2. We measured average image intensity in projected cross-sections of multiple embryos. Data are displayed as heat maps illustrating intensity with different colors (left, apical is on top; each column is a different embryo) or graphically, displaying pixel intensity vs. depth from the apical surface (right, each line is a different embryo). (Q, R) Plots displaying the average Baz image intensity in embryos of different genotypes (apical is to the left).
FIGURE 5:
FIGURE 5:
Neither Rap1 nor cno mutants have apparent defects in organization of the microtubule or actin cytoskeletons during cellularization, but Cno can recruit Baz to new locations. Genotypes, antigens, and embryonic stages indicated: stage 5, cellularization; stage 6, gastrulation onset. F-actin was detected with phalloidin. (A1–F2) MTs and centrosomes visualized in apical–basal sections (apical up, A1, B1, C–F1) or in cross-sections of nascent cells at level of nuclei (A2, B2, F2). WT, Rap1, and cno mutants all generate similarly polarized MT cytoskeletons during cellularization, with apical centrosomes (A1, B1, E, F1, arrowheads) and bundled MTs forming baskets projecting basally along the lateral surface (A1, B1, E, F1, arrows; A2, B2, F2, in cross-section). Even after Rap1 mutants begin to lose columnar cell shape and some cells have enlarged (B1, right arrowhead) or reduced apical ends, the MT cytoskeleton remains polarized. (C, D) At gastrulation onset (stage 6) Rap1 mutants retain a MT cytoskeleton with apical centrosomes (arrowheads) and MT baskets (arrows) even as they further lose columnar cell shape. (G–J, O, P) WT, Rap1, and cno mutants all exhibited myosin enrichment at the cellularization front (G, H, O, P, arrowheads) and form myosin rings (I, J). (K–N, Q, R) Actin is similarly localized in WT, Rap,, and cno mutants. Actin accumulates both in rings at the cellularization front (K, L, arrowheads; M, N, Q, R, in cross-section) and at nascent apical junctions (K, L, brackets). (S, T) Drosophila S2 cells transfected with Ed:GFP-Cno. (S) The extracellular domain of the fusion protein links cells, thus placing Cno at the cell–cell junction (arrow). (T) Endogenous Baz is then recruited to this site (arrows). (U–X) Embryos of the indicated embryonic stages overexpressing BazGFP using matGAL4. (U, W, X) Single apical–basal cross-sections. (V) Projected cross-sections. Overexpressed BazGFP localizes all along the apical basal axis and accumulates basally (U–W, arrowheads). There it can recruit DEcad (W′′, arrowheads) but does not displace Cno from the apical region of the cell (U–W, brackets). (X) As gastrulation proceeds, BazGFP relocalizes apically, where it now overlaps with Cno. Scale bars, 10 μm.
FIGURE 6:
FIGURE 6:
Rap1 and Cno are required for normal Baz localization during gastrulation, but other cues partially restore apical Baz. Genotypes and antigens indicated. (A–L) Baz localization in apical–basal sections through embryos of indicated stages. We cannot distinguish maternal/zygotic and zygotically rescued mutants at this stage; we thus divided embryos into two classes on the basis of phenotypic severity and show representative examples of each class. (A, B, G, H) In WT, Baz is apically localized at gastrulation onset (stage 6; A, G) and tightens up and moves to the extreme apical end of the cell during germband extension (stage 7; B, H). (C, D, I, J) In presumptive Rap1MZ (C, D) and cnoMZ mutants (I, J), Baz slowly becomes enriched apically but significant mislocalized Baz remains. (E, F, K, L) In maternally mutant but zygotically rescued Rap1M (E, F) and cnoM (K, L) embryos, restoration of apical Baz proceeds more completely than in maternal/zygotic mutants, but rescue remains incomplete. Scale bars, 10 μm. (M–X) Average image intensity along the apical–basal axis in projected cross-sections was assessed as in Figure 2, and data were displayed either as heat maps illustrating intensity with different colors (left, apical is on top; each column is a different embryo) or graphically, displaying pixel intensity vs. depth from the apical surface (right, each line is a different embryo). Genotypes and stages are indicated. Because this analysis did not allow us to definitively distinguish zygotically rescued embryos, we binned the embryos into the most severe and least severe (they should be present in a 1:1 ratio) and labeled these as presumptive maternal/zygotic or zygotically rescued embryos.
FIGURE 7:
FIGURE 7:
Rap1 is important for maintaining Baz localization in planar polarized apical junctions during gastrulation. (A–G) Surface views of stage 7 embryos. (A, C, E) Lateral views. (B, D, F) Close-ups of lateral epidermis. (D′, E′, F′) Further close-ups. (A, B) Baz becomes planar polarized in WT, with stronger accumulation on dorsal ventral boundaries (arrowheads) and weaker on anterior–posterior borders (arrows). (C, D) Presumptive Rap1MZ mutant (determined as in Figure 6 legend). Overall accumulation of Baz at cortex is reduced, Baz is lost from anterior–posterior borders (arrows), and the remaining staining is discontinuous. (E, F) Presumptive zygotically rescued Rap1 mutant. Cortical Baz is more prominent but still less continuous than in WT. (G) Myosin cables detach from anterior–posterior boundaries in Rap1 mutants (arrows), as we previously observed in cnoMZ mutants. Scale bars, 10 μm.
FIGURE 8:
FIGURE 8:
Baz is not required for Cno assembly into spot AJs but does regulate precise Cno localization during polarity establishment. (A–D) Late cellularization. (A, B) Apical-basal cross-sections. (C1, D1) Apical surface sections of embryo in A and B. (C2, D2) Surface sections at level of normal spot AJs. In WT (A, C), Cno localizes along the apical end of the lateral membrane (A′, bracket) to spot AJs (C2). In maximum-intensity projections of multiple apical–basal sections (A′), cables of Cno that localize to tricellular junctions are apparent. Cno is also largely removed from the apical surface during cellularization (A′, E′, arrows). Reducing Baz by RNAi (B, F) leads to Cno spreading more basally (B′, bracket, vs. A′, bracket), to loss of organized Cno cables (B′, maximum-intensity projections), and to failure to exclude Cno puncta from the apical membrane (B′, arrow, C1′ vs. D1′), but Cno still continues to assemble into spot AJs (D2). (E, F) Gastrulation onset (stage 6). In WT, Cno remains in spot AJs (E′, bracket), and the apical–basal cables at tricellular junctions become even more prominent (E′, projections). baz RNAi leads to spread of Cno basally (F′), perturbs assembly of Cno cables at tricellular junctions (F′ maximum-intensity projection), and allows Cno puncta to accumulate at the apical surface. (F′, arrow and inset). Scale bars, 10 μm.
FIGURE 9:
FIGURE 9:
aPKC mutants fail to exclude Cno from the apical domain. (A, B, I, J) Apical-basal sections. (C–H, K, L) En face views. (A–G) Midcellularization. Cno accumulates along the apicolateral membrane (A, B, brackets) and in the apical region of the cell (A, B, arrows) in both WT (A′) and aPKC mutants (B′). Elevated apical accumulation of Cno in aPKC mutants is already apparent in en face views (C vs. D), but Cno continues to accumulate in spot AJs (E, G vs. F, H), and Arm accumulation in basal junctions is not perturbed (A, B, arrowheads). (I–L) Late cellularization. Whereas in WT, Cno is removed from the apical region (I′, arrow, K), Cno remains there in aPKC mutants (J′, arrow, L). Scale bars, 10 μm.
FIGURE 10:
FIGURE 10:
Rap1, Baz, and aPKC play roles in establishing columnar cell shape during cellularization. (A–E) Cell shapes during late cellularization at three different apical–basal depths (0.9, 3.0, and 6.9 μm below the apical surface). Cells were stained with antibody to the membrane protein Nrt, background was removed and images were processed with a Watershed algorithm and thresholded (insets) to allow ImageJ to measure cell area. Representative embryos are shown. The degree of variation in cell shape is expressed by the coefficient of variation (CV). Arrows indicate examples of variable cell areas. (F–H) Beeswarm scatter plots of cell areas for all genotypes examined at the indicated depths. Significance of the degree of cell area variability (CV) was assessed by Tukey's HSD test to correct for multiple comparisons. Red lines indicate the median value. WT cells are essentially columnar (A–A′′) and exhibit relatively little variation in cell area from cell to cell; what variation does exist is most prominent in the apicalmost slice. cno mutants (B–B′′) also exhibit relatively uniform cell shapes. Rap1mutants (C–C′′) are more variable in cell area than WT, and this difference reaches significance in the basal section. baz RNAi (D–D′′) and aPKCMZ mutants (E–E′′) are significantly more variable in cell area than WT in the apicalmost region. Scale bar, 10 μm.

Similar articles

Cited by

References

    1. Abe K, Takeichi M. EPLIN mediates linkage of the cadherin catenin complex to F-actin and stabilizes the circumferential actin belt. Proc Natl Acad Sci USA. 2008;105:13–19. - PMC - PubMed
    1. Assemat E, Bazellieres E, Pallesi-Pocachard E, Le Bivic A, Massey-Harroche D. Polarity complex proteins. Biochim Biophys Acta. 2008;1778:614–630. - PubMed
    1. Bertet C, Sulak L, Lecuit T. Myosin-dependent junction remodelling controls planar cell intercalation and axis elongation. Nature. 2004;429:667–671. - PubMed
    1. Bilder D, Schober M, Perrimon N. Integrated activity of PDZ protein complexes regulates epithelial polarity. Nat Cell Biol. 2003;5:53–58. - PubMed
    1. Boettner B, Harjes P, Ishimaru S, Heke M, Fan HQ, Qin Y, Van Aelst L, Gaul U. The AF-6 homolog canoe acts as a Rap1 effector during dorsal closure of the Drosophila embryo. Genetics. 2003;165:159–169. - PMC - PubMed

Publication types

MeSH terms

LinkOut - more resources