. 2013 Mar;24(6):870-81.
doi: 10.1091/mbc.E12-10-0753. Epub 2013 Jan 30.

TORC1-regulated protein kinase Npr1 phosphorylates Orm to stimulate complex sphingolipid synthesis

Affiliations

TORC1-regulated protein kinase Npr1 phosphorylates Orm to stimulate complex sphingolipid synthesis

Mitsugu Shimobayashi et al. Mol Biol Cell. 2013 Mar.

Abstract

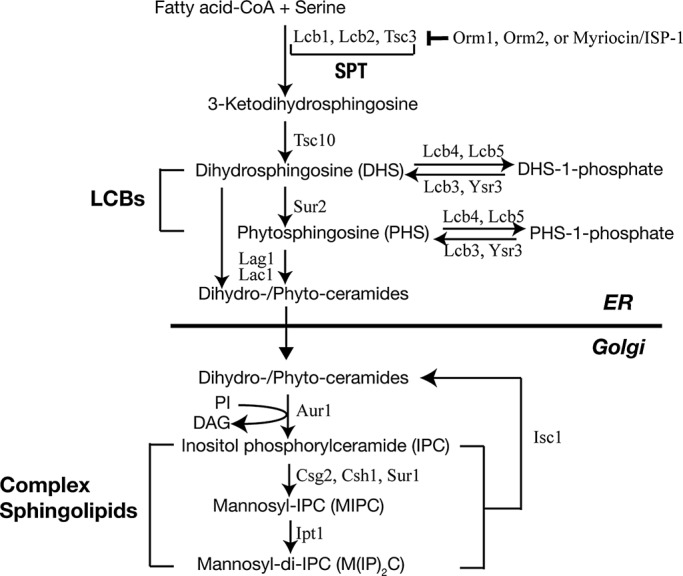
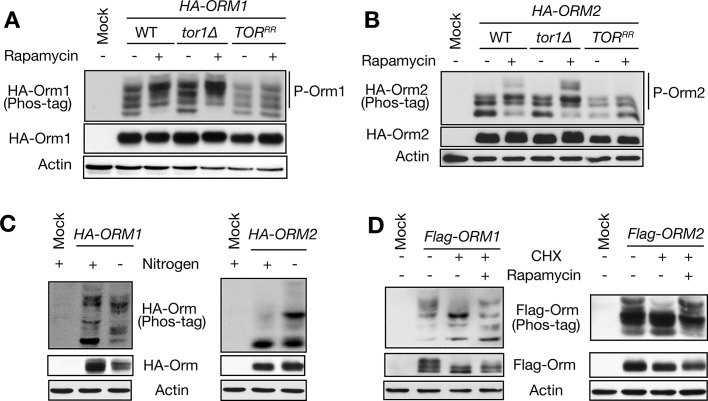
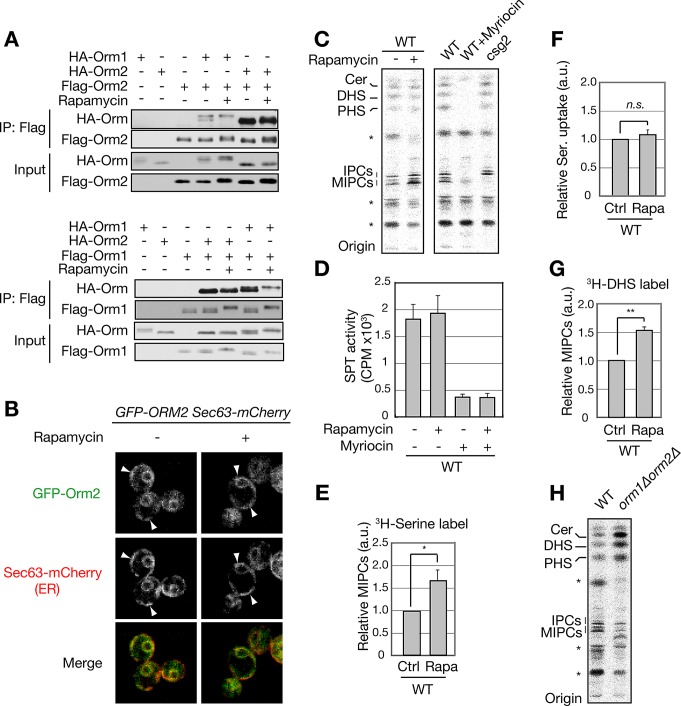
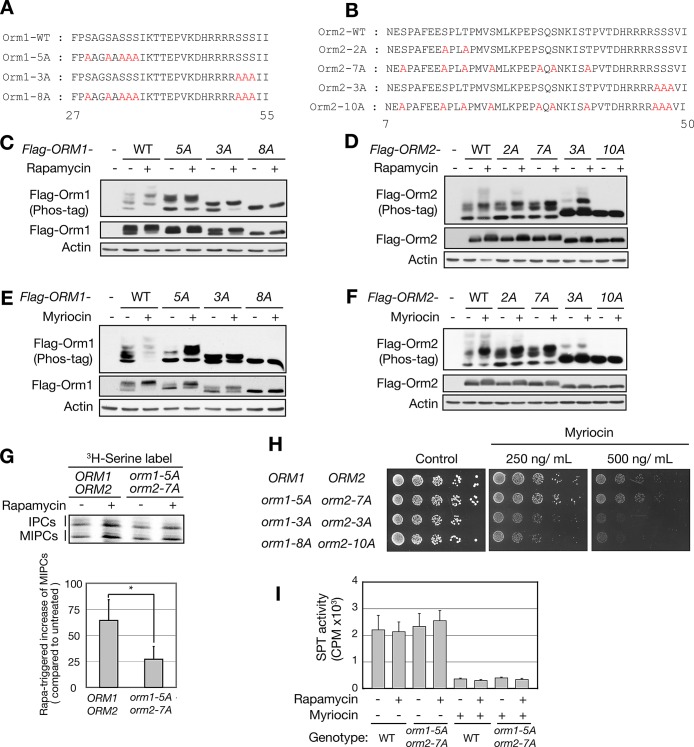
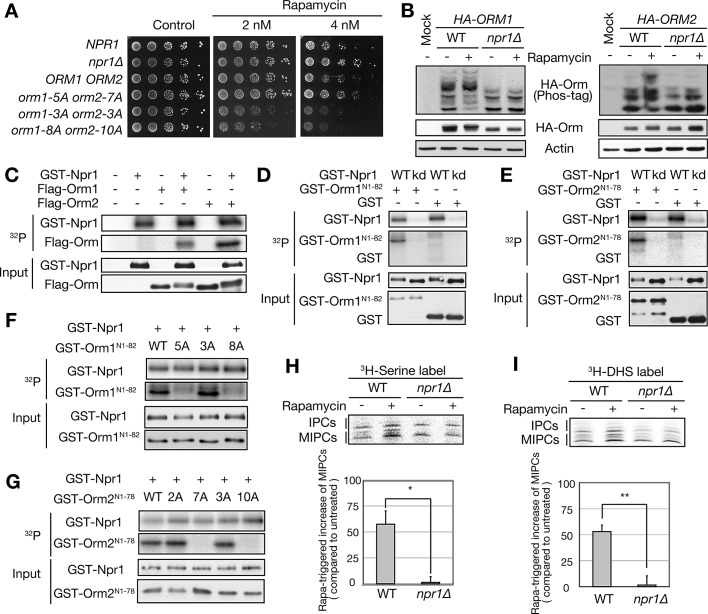
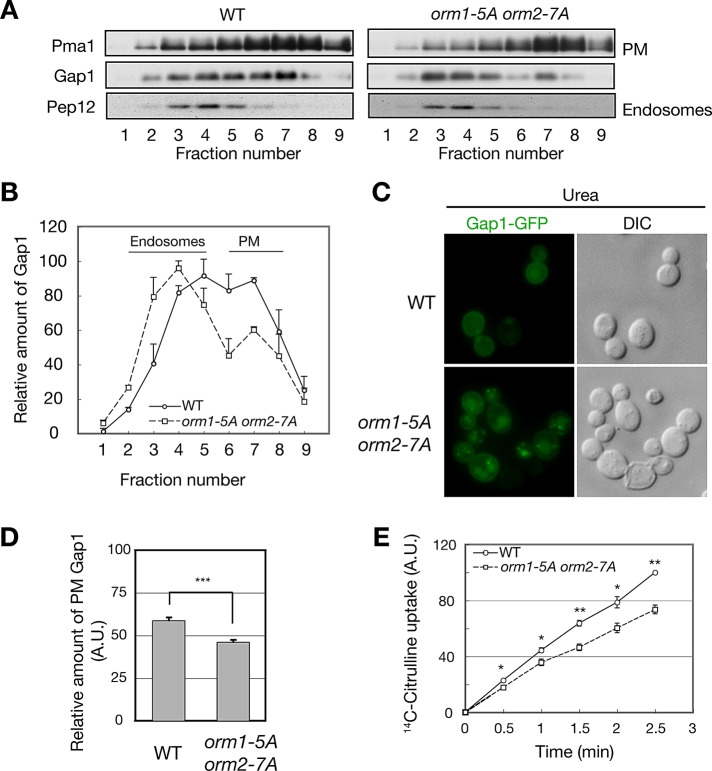
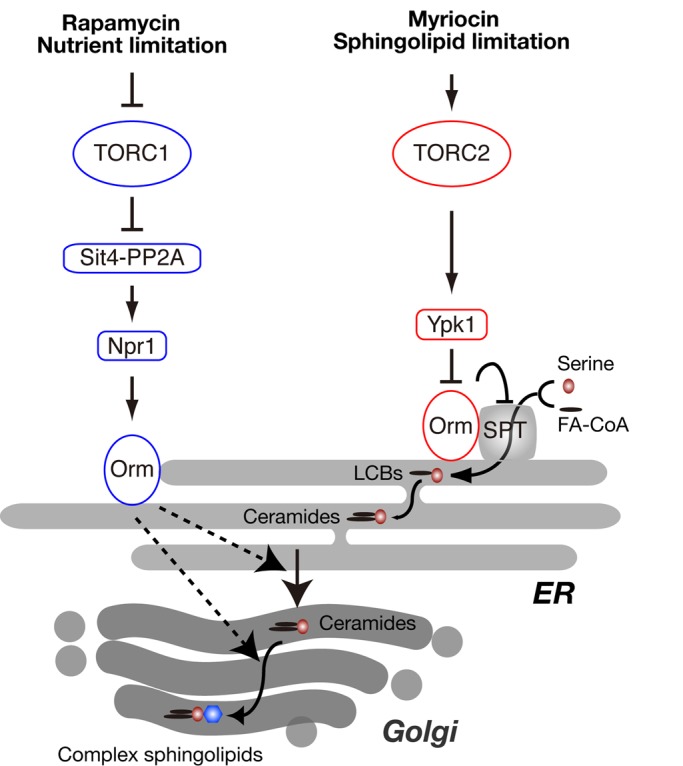
The evolutionarily conserved Orm1 and Orm2 proteins mediate sphingolipid homeostasis. However, the homologous Orm proteins and the signaling pathways modulating their phosphorylation and function are incompletely characterized. Here we demonstrate that inhibition of nutrient-sensitive target of rapamycin complex 1 (TORC1) stimulates Orm phosphorylation and synthesis of complex sphingolipids in Saccharomyces cerevisiae. TORC1 inhibition activates the kinase Npr1 that directly phosphorylates and activates the Orm proteins. Npr1-phosphorylated Orm1 and Orm2 stimulate de novo synthesis of complex sphingolipids downstream of serine palmitoyltransferase. Complex sphingolipids in turn stimulate plasma membrane localization and activity of the nutrient scavenging general amino acid permease 1. Thus activation of Orm and complex sphingolipid synthesis upon TORC1 inhibition is a physiological response to starvation.


Figures

FIGURE 1:
FIGURE 1:
Schematic diagram of de novo sphingolipid biosynthesis in yeast.
FIGURE 2:
FIGURE 2:
TORC1 negatively regulates Orm phosphorylation. (A, B) Immunoblot analysis of Orm1 (A) and Orm2 (B) phosphorylation in wild-type (WT), tor1∆, and rapamycin-resistant TOR (TORRR) cells. Growing cells expressing HA-Orm proteins were treated with rapamycin (200 ng/ml) for 1 h. The total lysates were resolved by a phospho–affinity gel and conventional SDS–PAGE gels and analyzed by Immunoblot against HA and actin, a loading control. TB50a was used as a mock control. (C) Immunoblot analysis of Orm phosphorylation upon nitrogen starvation. Growing cells expressing HA-Orm1 or HA-Orm2 were shifted to nitrogen-free medium (SD-N) and cultured for 1 h. The total lysates were analyzed as described in A and B. (D) Immunoblot analysis of Orm phosphorylation after 1-h treatment of cycloheximide (CHX, 25 μg/ml) with or without cotreatment of rapamycin. The total lysates prepared from FLAG-Orm1– or FLAG-Orm2–expressing cells were analyzed as in A and B, except that a FLAG antibody was used.
FIGURE 3:
FIGURE 3:
TORC1 inhibition increases de novo synthesis of complex sphingolipids downstream of SPT. (A) Coimmunoprecipitation analysis of Orm1 and Orm2. Immunoprecipitation of FLAG-Orm1 and Orm2 was performed as described in Materials and Methods. Immunoprecipitated proteins were analyzed by Immunoblot as in Figure 2. (B) Confocal microscopic analyses of GFP-Orm2 with (+) or without (–) 200 ng/ml rapamycin treatment for 1 h. Sec63-mCherry was used as a marker for ER localization. Arrows indicate cER. (C) TLC analysis of [3H]serine-labeled sphingolipids. Growing cells were treated with (+) or without (–) 200 ng/ml rapamycin for 1 h and labeled with [3H]serine for 30 min. The extracted lipids were subjected to mild alkaline hydrolysis and separated by TLC. Sphingolipid profiles of myriocin-treated WT cells and csg2∆ cells were used to identify sphingolipids and IPCs/MIPCs, respectively. Ceramides, DHS, and PHS were identified by mobility of respective standard lipid species on TLC. DHS, dihydrosphingosine; IPCs, inositol phosphorylceramides; MIPCs, mannosyl IPCs; PHS, phytosphingosine. *Unidentified myriocin-insensitive lipids. (D) in vitro SPT assay. SPT activity was measured by incorporation of [3H]serine into 3-ketosphinganine as described in Materials and Methods. (E) Quantification of [3H]serine-labeled MIPCs (mean ± SEM) in Figure 3C. *p < 0.05. (F) Serine uptake assay in rapamycin-treated and untreated cells. Cells were treated with rapamycin and labeled with [3H]serine as in C. Incorporation of [3H]serine was measured by a scintillation counter. Data are presented as mean ± SEM. (G) Quantification of [3H]DHS-labeled MIPCs (mean ± SEM). Cells were treated with rapamycin and labeled with [3H]DHS as in C. **p < 0.01. (H) TLC analysis of [3H]serine-labeled sphingolipids in WT and orm1∆orm2∆ cells. The [3H]serine labeling, lipid preparation, and TLC were performed as in C. *Unidentified myriocin-insensitive lipids.
FIGURE 4:
FIGURE 4:
TORC1 inhibition promotes de novo complex sphingolipid synthesis via Orm phosphorylation. (A, B) An N-terminal peptide sequence of Orm1 (A) and Orm2 (B). The phosphodeficient mutations are highlighted in red. (C) Immunoblot analysis of Orm1 phosphorylation in phosphodeficient mutants of Orm1 upon rapamycin treatment. Cells expressing FLAG-Orm1 summarized in A were treated with (+) or without (–) rapamycin (200 ng/ml) for 1 h. The total lysates were analyzed as in Figure 2D. (D) Immunoblot analysis of Orm2 phosphorylation in phosphodeficient mutants of Orm2 upon rapamycin treatment. Cells expressing FLAG-Orm2 summarized in B were treated with (+) or without (–) rapamycin (200 ng/ml) for 1 h. (E, F) Immunoblot analysis of Orm1 (E) and Orm2 (F) phosphorylation in phosphodeficient mutants upon myriocin treatment. Same cells as in C and D were treated with (+) or without (–) myriocin (500 ng/ml) for 1 h. (G) TLC analysis of [3H]serine-labeled IPCs and MIPCs in WT (ORM1 ORM2) and Ala mutants in rapamycin-responsive sites (orm1-5A orm2-7A). Labeling and TLC analysis were performed as in Figure 3C, and rapamycin-triggered increase of MIPCs was quantified in a bar graph (mean ± SEM). *p < 0.05. (H) Phosphodeficient mutant alleles of Orm proteins were analyzed for growth on SD plates in the presence of myriocin. The plates were incubated at 30ºC for 3 d. (I) in vitro SPT assay. SPT activity was measured by incorporation of [3H]serine into 3-ketosphinganine as described in Materials and Methods.
FIGURE 5:
FIGURE 5:
TORC1 mediates Orm phosphorylation and complex sphingolipid synthesis via Npr1. (A) WT, npr1∆, and phosphodeficient mutant alleles of Orm proteins were analyzed for growth on SD plates in the presence of rapamycin. The plates were incubated at 30ºC for 3 d. (B) Immunoblot analysis of Orm phosphorylation in rapamycin-treated WT or npr1∆ cells. Cells expressing HA-Orm1 or HA-Orm2 were treated with (+) or without (–) rapamycin (200 ng/ml) for 1 h. The total lysates were analyzed as in Figure 2A. (C–E) In vitro kinase assay of GST-Npr1 toward native Flag-Orm1 and -Orm2 purified from yeast (C) or N-terminal–truncated recombinant GST-Orm1 (D) and GST-Orm2 (E) as described in Materials and Methods. kd, kinase dead Npr1-K467R. (F, G) In vitro kinase assay of GST-Npr1 toward recombinant Ala mutant alleles of GST-Orm1 (F) and GST-Orm2 (G). (H, I) TLC analysis of [3H]serine (H)– or [3H]DHS (I)–labeled IPCs and MIPCs in WT and npr1∆ cells. Growing cells were treated with (+) or without (–) rapamycin for 1 h and labeled with [3H]serine (H) or [3H]DHS (I) for 30 min. The extracted lipids were subjected to mild alkaline hydrolysis and separated by TLC. The bar graphs show quantification of rapamycin-triggered increase of MIPCs (mean ± SEM). *p < 0.05, **p < 0.01.
FIGURE 6:
FIGURE 6:
Npr1-mediated Orm phosphorylation stimulates Gap1 PM localization and activity. (A) Subcellular fractionation analysis of Gap1 in Flag-ORM1 Flag-ORM2 (WT) and Flag-orm1-5A Flag-orm2-7A (orm1-5A orm2-7A) cells. Cells were grown in SD media and shifted to urea media. After 2 h of incubation, harvested cells were lysed and fractionated by ultracentrifugation on continuous 20–60% (wt/wt) sucrose gradients. The fractions were resolved by SDS–PAGE and analyzed by immunoblot against Pma1 (a plasma membrane marker), Gap1, and Pep12 (an endosomal marker). (B) Quantification of relative Gap1 in A. Data are presented as means ± SEM. (C) Microscopic analysis of Gap1-GFP in Flag-ORM1 Flag-ORM2 (WT) and Flag-orm1-5A Flag-orm2-7A (orm1-5A orm2-7A) cells. Cells were cultured in SD-N supplemented with urea for 2 h and analyzed by fluorescence microscopy. (D) Quantification of relative expression of PM Gap1-GFP. The intensities of PM GFP signals were normalized to those of total GFP signals from at least 50 cells. Data are presented as means ± SEM. ***p < 10−9. (E) The [14C]citrulline uptake in Flag-ORM1 Flag-ORM2 (WT) and Flag-orm1-5A Flag-orm2-7A (orm1-5A orm2-7A) cells. Cells were cultured in SD-N supplemented with urea and assayed for [14C]citrulline incorporation as described in Materials and Methods. The relative uptake of [14C]citrulline ± SEM respect to WT cells is shown. *p < 0.05, **p < 0.01.
FIGURE 7:
FIGURE 7:
Model of regulation of sphingolipid synthesis by TORC1 and TORC2 signaling. FA-CoA, fatty acid-CoA.

Similar articles

Cited by

References

    1. Arndt KT, Styles CA, Fink GR. A suppressor of a HIS4 transcriptional defect encodes a protein with homology to the catalytic subunit of protein phosphatases. Cell. 1989;56:527–537. - PubMed
    1. Aronova S, Wedaman K, Aronov PA, Fontes K, Ramos K, Hammock BD, Powers T. Regulation of ceramide biosynthesis by TOR complex 2. Cell Metab. 2008;7:148–158. - PMC - PubMed
    1. Banuelos MG, Moreno DE, Olson DK, Nguyen Q, Ricarte F, Aguilera-Sandoval CR, Gharakhanian E. Genomic analysis of severe hypersensitivity to hygromycin B reveals linkage to vacuolar defects and new vacuolar gene functions in Saccharomyces cerevisiae. Curr Genet. 2010;56:121–137. - PMC - PubMed
    1. Barrett JC, et al. Genome-wide association study and meta-analysis find that over 40 loci affect risk of type 1 diabetes. Nat Genet. 2009;41:703–707. - PMC - PubMed
    1. Barrett JC, et al. Genome-wide association defines more than 30 distinct susceptibility loci for Crohn's disease. Nat Genet. 2008;40:955–962. - PMC - PubMed

Publication types

MeSH terms