. 2013 Jan 30;280(1755):20122974.
doi: 10.1098/rspb.2012.2974. Print 2013 Mar 22.

Transcription and redox enzyme activities: comparison of equilibrium and disequilibrium levels in the three-spined stickleback

Affiliations

Transcription and redox enzyme activities: comparison of equilibrium and disequilibrium levels in the three-spined stickleback

M Nikinmaa et al. Proc Biol Sci. .

Abstract

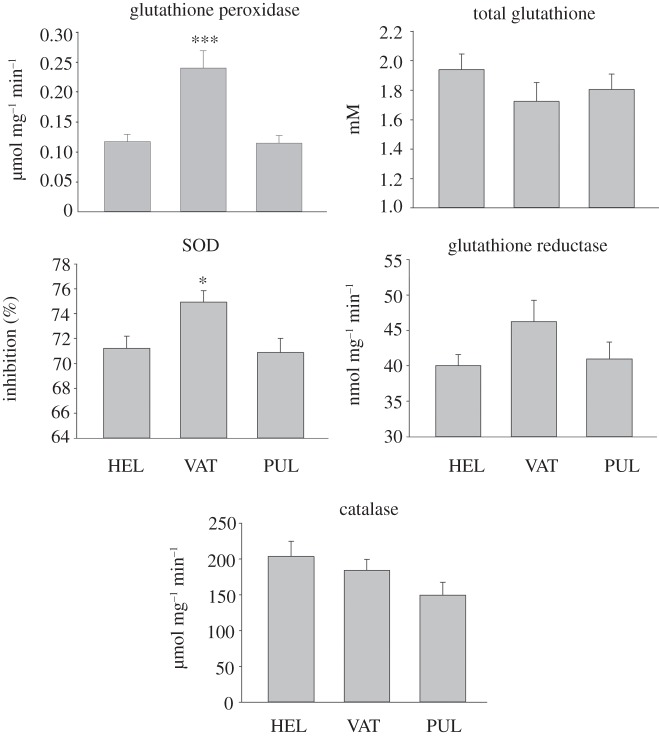
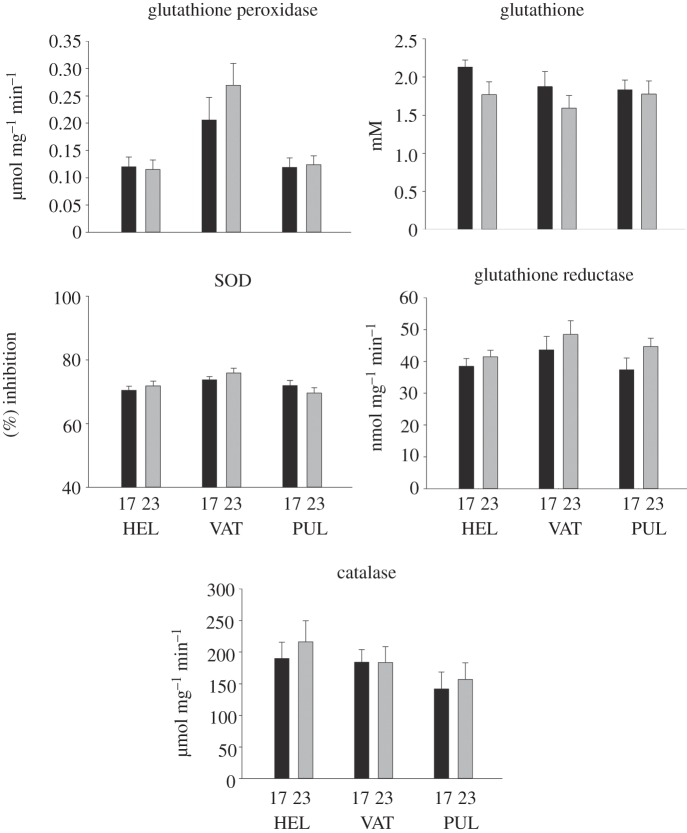
Evolutionary and acclimatory responses require functional variability, but in contrast with mRNA and protein abundance data, most physiological measurements cannot be obtained in a high-throughput manner. Consequently, one must either rely on high-throughput transcriptomic or proteomic data with only predicted functional information, or accept the limitation that most physiological measurements can give fewer data than those provided by transcriptomics or proteomics. We evaluated how transcriptional and redox enzyme activity data agreed with regard to population differentiation (i.e. a system in steady state in which any time lag between transcription, translation and post-translational effects would be irrelevant) and in response to an acute 6°C increase in temperature (i.e. a disequilibrium state wherein translation could not have caught up with transcription) in the three-spined stickleback (Gasterosteus aculeatus). Transcriptional and enzyme activity data corresponded well with regard to population differentiation, but less so with regard to acute temperature increase. The data thus suggest that transcriptional and functional measurements can lead to similar conclusions when a biological system is in a steady state. The responses to acute changes must, as has been demonstrated earlier, be based on changes in cellular conditions or properties of existing proteins without significant de novo synthesis of new gene products.


Figures

Figure 1.
Figure 1.
GPX, GSR, SOD and CAT activities and total GSH concentration in Helsinki (HEL, n = 18), Vättern (VAT, n = 13) and Pulmanki (PUL, n = 18) populations. The statistical significance of the difference between the means was tested using two-way ANOVA with population and sex as explanatory factors. An ad hoc test to indicate differences between individual groups was carried out using the Holm–Sidak method. Asterisks indicate that the population with asterisks differs significantly from the other populations. *p < 0.05; ***p < 0.001.
Figure 2.
Figure 2.
Box-percentile plots showing the bootstrap distribution (10 000 iterations) for estimates of the index of quantitative trait differentiation (QST) for enzyme data. Vertical lines denote the putative range of neutral differentiation (FST), as inferred from variation in 17 assumedly neutral microsatellite loci. (Online version in colour.)
Figure 3.
Figure 3.
CoIA of between-group ordinations of log2 transcript abundance (triangles) and GSH enzymatics (circles). Global similarity (co-inertia) between transcription and enzyme datasets is 35.7% (p = 0.002). A total of 65.7% of co-inertia is described by the first axis (screeplot; inset lower right) which appears to describe differentiation between Lake Vättern samples from the other populations. Loadings on this axis (correlation circle; inset upper right) suggest that these differences are largely driven by SOD and GPX activity. The second co-inertia axis capture 22% of total (co)variation in the data, and describes common differences attributable to thermal treatment—this ‘effect’ seems more pronounced in Helsinki and Lake Pulmankijärvi populations. Loadings on axis two suggest that thermally induced patterns of (co)variation are mostly observed with respect to GSR and CAT activity. (Online version in colour.)
Figure 4.
Figure 4.
The effects of temperature on GPX, GSR, SOD and CAT activities, and total GSH concentration in the different populations. n = 9 for the Helsinki population, six for the Lake Vättern population and nine for the Lake Pulmankijärvi population at 23°C, and nine for the Helsinki population, seven for the Lake Vättern population and nine for the Lake Pulmankijärvi population at 17°C . The statistical significance of the differences between means was determined using two-way ANOVA with population and temperature as explanatory factors. An ad hoc test to indicate differences between individual groups was carried out using the Holm–Sidak method. No statistically significant effects were observed.

References

    1. Furlong EEM. 2011. Molecular biology: a fly in the face of genomics. Nature 471, 458–45910.1038/471458a (doi:10.1038/471458a) - DOI - DOI - PubMed
    1. Abreu RD, Penalva LO, Marcotte EM, Vogel C. 2009. Global signatures of protein and mRNA expression levels. Mol. Biosyst. 5, 1512–1526 - PMC - PubMed
    1. Schwanhausser B, Busse D, Li N, Dittmar G, Schuchhardt J, Wolf J, Chen W, Selbach M. 2011. Global quantification of mammalian gene expression control. Nature 473, 337–34210.1038/nature10098 (doi:10.1038/nature10098) - DOI - DOI - PubMed
    1. Nikinmaa M, Waser W. 2007. Molecular and cellular studies in evolutionary physiology of natural vertebrate populations: influences of individual variation and genetic components on sampling and measurements. J. Exp. Biol. 210, 1847–185710.1242/jeb.002717 (doi:10.1242/jeb.002717) - DOI - DOI - PubMed
    1. Oleksiak MF, Roach JL, Crawford DL. 2005. Natural variation in cardiac metabolism and gene expression in Fundulus heteroclitus. Nat. Genet. 37, 67–72 - PMC - PubMed

Publication types

LinkOut - more resources