Review
. 2013 Jan 31;5(1):9.
doi: 10.1186/gm413. eCollection 2013.

Visualizing multidimensional cancer genomics data

Affiliations
Review

Visualizing multidimensional cancer genomics data

Michael P Schroeder et al. Genome Med. .

Abstract

Cancer genomics projects employ high-throughput technologies to identify the complete catalog of somatic alterations that characterize the genome, transcriptome and epigenome of cohorts of tumor samples. Examples include projects carried out by the International Cancer Genome Consortium (ICGC) and The Cancer Genome Atlas (TCGA). A crucial step in the extraction of knowledge from the data is the exploration by experts of the different alterations, as well as the multiple relationships between them. To that end, the use of intuitive visualization tools that can integrate different types of alterations with clinical data is essential to the field of cancer genomics. Here, we review effective and common visualization techniques for exploring oncogenomics data and discuss a selection of tools that allow researchers to effectively visualize multidimensional oncogenomics datasets. The review covers visualization methods employed by tools such as Circos, Gitools, the Integrative Genomics Viewer, Cytoscape, Savant Genome Browser, StratomeX and platforms such as cBio Cancer Genomics Portal, IntOGen, the UCSC Cancer Genomics Browser, the Regulome Explorer and the Cancer Genome Workbench.


Figures

Figure 1
Figure 1
Cancer genomics projects generate multidimensional data for a cohort of patients. Different technological platforms will screen for different genomic and epigenomic changes in each patient, generating multidimensional data sets. The data are usually represented by clinical data along with one or more of the three main types of visualization tools: genomic coordinates, matrix heatmaps and networks.
Figure 2
Figure 2
Screenshots of tools that are frequently used in cancer genomics research distributed according to their visualization principles. Each of the three visualization methods - matrix heatmaps, genomic coordinates and networks - are associated with a point of the triangle. Tools that are placed close to one of these points mainly use the visualization method associated with that point; those placed in between use a mixed-model visualization method.
Figure 3
Figure 3
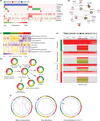
Four case studies are represented using one or several of the major visualization methods applied in oncogenomics. (a) Heatmap of oncogenomic alterations ordered by mutual exclusivity plotted with Gitools. In the upper half of the image, colors indicate the type of alteration: mutations (green), CNA gain (red) and CNA loss (blue). The heatmap below shows expression data (high expression in red and low expression in green) for the same samples and genes, allowing the visual observation that genomics regions whose copy number is amplified tend to have higher expression values. (b) The same data as in (a), with the same color code for alterations, represented as a network of functional interactions between the genes, extracted from the cBio Cancer Genomics Portal. The halo around the four selected nodes is divided into three sectors. Changes in the proportion of samples with altered copy number are indicated in red (gain) or blue (loss) in the top sector, whereas changes in the proportion of samples with mutations are indicated in green in the lower-right sector. Expression changes are shown in light red (increase) and light blue (decrease) in the lower-left sector of the halo. Panels (c-e) include clinical information. Each tumor sample is assigned to one of four subtypes of glioblastoma, color-coded as dark green (classical), light green (mesenchymal), orange (neural) and red (proneural). (c) Heatmap of pathway expression levels plotted with Gitools. Each column is a tumor sample. The subtype is represented in colors in the top row and each row represents a biological pathway. The color of each cell indicates the Zscore of the sample level enrichment analysis (SLEA) of the pathway in the sample. Clear differences in the expression values in different pathways can be observed for different cell subtypes. (d) Same data as in (c) represented in the form of a network, drawn using CircleMap. Each node is a pathway and its edges indicate functional interactions between pathways as extracted from KEGG. The two halos around each node indicate the Zscore of the pathway in each sample and the clinical subtype. (e) CNA and expression data for the EGFR gene region of glioblastoma samples as shown by IGV. The top part of the plot indicates the genomic position we are observing. Each sample is shown as a horizontal track, ordered by clinical subtype. Within each clinical subtype, the tracks in the upper half illustrate CNA whereas those below show expression. This visualization reveals clear differences in the CNA and expression of the EGFR locus in different clinical subtypes. (f) Adaptations of Circos plots of three breast tumors with three very different alteration landscapes. The four circles in each plot, from outermost inwards, represent the human chromosomes, mutations, copy number alterations, and structural rearrangement.

References

    1. Parsons DW, Jones S, Zhang X, Lin JC-H, Leary RJ, Angenendt P, Mankoo P, Carter H, Siu I-M, Gallia GL, Olivi A, McLendon R, Rasheed BA, Keir S, Nikolskaya T, Nikolsky Y, Busam DA, Tekleab H, Diaz LA, Hartigan J, Smith DR, Strausberg RL, Marie SKN, Shinjo SMO, Yan H, Riggins GJ, Bigner DD, Karchin R, Papadopoulos N, Parmigiani G. et al.An integrated genomic analysis of human glioblastoma multiforme. Science. 2008;321:1807–1812. doi: 10.1126/science.1164382. - DOI - PMC - PubMed
    1. The Cancer Genome Atlas Consortium. Comprehensive genomic characterization defines human glioblastoma genes and core pathways. Nature. 2008;455:1061–1068. doi: 10.1038/nature07385. - DOI - PMC - PubMed
    1. The Cancer Genome Atlas Research Network. Integrated genomic analyses of ovarian carcinoma. Nature. 2011;474:609–615. doi: 10.1038/nature10166. - DOI - PMC - PubMed
    1. International Cancer Genome Consortium. Hudson TJ, Anderson W, Artez A, Barker AD, Bell C, Bernabé RR, Bhan MK, Calvo F, Eerola I, Gerhard DS, Guttmacher A, Guyer M, Hemsley FM, Jennings JL, Kerr D, Klatt P, Kolar P, Kusada J, Lane DP, Laplace F, Youyong L, Nettekoven G, Ozenberger B, Peterson J, Rao TS, Remacle J, Schafer AJ, Shibata T, Stratton MR. et al.International network of cancer genome projects. Nature. 2010;464:993–998. doi: 10.1038/nature08987. - DOI - PMC - PubMed
    1. Ciriello G, Cerami EG, Sander C, Schultz N. Mutual exclusivity analysis identifies oncogenic network modules. Genome Res. 2012;22:398–406. doi: 10.1101/gr.125567.111. - DOI - PMC - PubMed