

Maximum likelihood estimation of frequencies of known haplotypes from pooled sequence data
- PMID: 23364324
- PMCID: PMC3670732
- DOI: 10.1093/molbev/mst016
Maximum likelihood estimation of frequencies of known haplotypes from pooled sequence data
Abstract
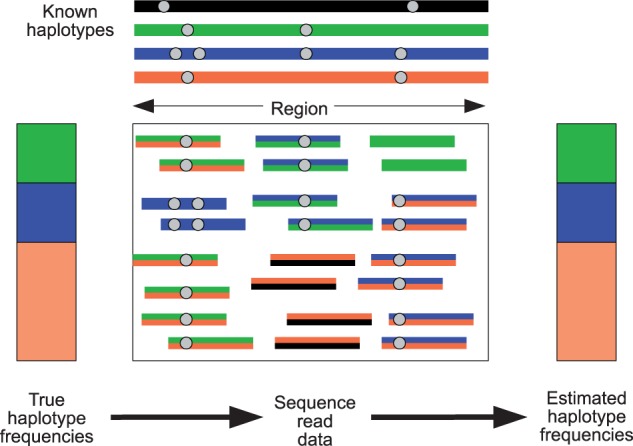
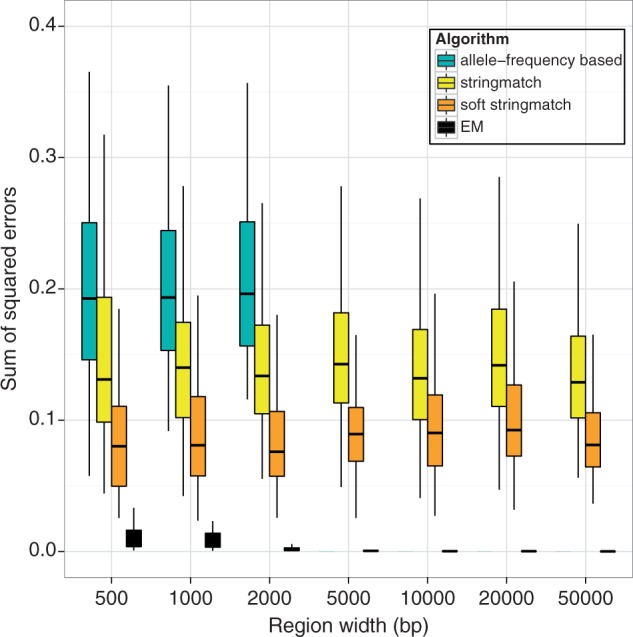
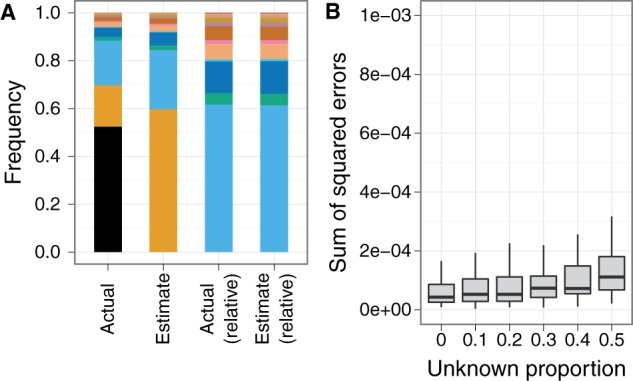
DNA samples are often pooled, either by experimental design or because the sample itself is a mixture. For example, when population allele frequencies are of primary interest, individual samples may be pooled together to lower the cost of sequencing. Alternatively, the sample itself may be a mixture of multiple species or strains (e.g., bacterial species comprising a microbiome or pathogen strains in a blood sample). We present an expectation-maximization algorithm for estimating haplotype frequencies in a pooled sample directly from mapped sequence reads, in the case where the possible haplotypes are known. This method is relevant to the analysis of pooled sequencing data from selection experiments, as well as the calculation of proportions of different species within a metagenomics sample. Our method outperforms existing methods based on single-site allele frequencies, as well as simple approaches using sequence read data. We have implemented the method in a freely available open-source software tool.
Figures
Similar articles
-
Estimation of haplotype frequencies, linkage-disequilibrium measures, and combination of haplotype copies in each pool by use of pooled DNA data.Am J Hum Genet. 2003 Feb;72(2):384-98. doi: 10.1086/346116. Epub 2003 Jan 17. Am J Hum Genet. 2003. PMID: 12533787 Free PMC article.
-
Accuracy of haplotype frequency estimation for biallelic loci, via the expectation-maximization algorithm for unphased diploid genotype data.Am J Hum Genet. 2000 Oct;67(4):947-59. doi: 10.1086/303069. Epub 2000 Aug 22. Am J Hum Genet. 2000. PMID: 10954684 Free PMC article.
-
Ehapp2: Estimate haplotype frequencies from pooled sequencing data with prior database information.J Bioinform Comput Biol. 2016 Aug;14(4):1650017. doi: 10.1142/S0219720016500177. Epub 2016 Apr 14. J Bioinform Comput Biol. 2016. PMID: 27216711
-
Notes on the maximum likelihood estimation of haplotype frequencies.Ann Hum Genet. 2004 May;68(Pt 3):257-64. doi: 10.1046/j.1529-8817.2003.00088.x. Ann Hum Genet. 2004. PMID: 15180706
-
[Estimation of haplotypes based on DNA pooling].Zhong Nan Da Xue Xue Bao Yi Xue Ban. 2011 May;36(5):457-60. doi: 10.3969/j.issn.1672-7347.2011.05.015. Zhong Nan Da Xue Xue Bao Yi Xue Ban. 2011. PMID: 21685704 Review. Chinese.
Cited by
-
"Select and Resequence" Methods Enable a Genome-Wide Association Study of the Dimorphic Human Fungal Pathogen Coccidioides posadasii.Genome Biol Evol. 2025 Jul 3;17(7):evaf135. doi: 10.1093/gbe/evaf135. Genome Biol Evol. 2025. PMID: 40611625 Free PMC article.
-
Phenotypic and genomic signatures of interspecies cooperation and conflict in naturally occurring isolates of a model plant symbiont.Proc Biol Sci. 2022 Jul 13;289(1978):20220477. doi: 10.1098/rspb.2022.0477. Epub 2022 Jul 13. Proc Biol Sci. 2022. PMID: 35858063 Free PMC article.
-
Shifting the paradigm in Evolve and Resequence studies: From analysis of single nucleotide polymorphisms to selected haplotype blocks.Mol Ecol. 2019 Feb;28(3):521-524. doi: 10.1111/mec.14992. Mol Ecol. 2019. PMID: 30793868 Free PMC article.
-
Host-Associated Rhizobial Fitness: Dependence on Nitrogen, Density, Community Complexity, and Legume Genotype.Appl Environ Microbiol. 2022 Aug 9;88(15):e0052622. doi: 10.1128/aem.00526-22. Epub 2022 Jul 19. Appl Environ Microbiol. 2022. PMID: 35852362 Free PMC article.
-
Detection of Pathogenic Microbe Composition Using Next-Generation Sequencing Data.Front Genet. 2020 Nov 30;11:603093. doi: 10.3389/fgene.2020.603093. eCollection 2020. Front Genet. 2020. PMID: 33329748 Free PMC article.
References
-
- Burke MK, Dunham JP, Shahrestani P, Thornton KR, Rose MR, Long AD. Genome-wide analysis of a long-term evolution experiment with Drosophila. Nature. 2010;467:587–590. - PubMed
-
- Cheesman SJ, de Roode JC, Read AF, Carter R. Real-time quantitative PCR for analysis of genetically mixed infections of malaria parasites: technique validation and applications. Mol Biochem Parasitol. 2003;131:83–91. - PubMed
-
- Dempster A, Laird N, Rubin D. Maximum likelihood from incomplete data via the EM algorithm. J R Stat Soc Ser B. 1977;39:1–38.
Publication types
MeSH terms
Substances
Grants and funding
LinkOut - more resources
Full Text Sources
Other Literature Sources
