. 2013 Mar;140(5):1045-54.
doi: 10.1242/dev.088724. Epub 2013 Jan 30.

The Frizzled-dependent planar polarity pathway locally promotes E-cadherin turnover via recruitment of RhoGEF2

Affiliations

The Frizzled-dependent planar polarity pathway locally promotes E-cadherin turnover via recruitment of RhoGEF2

Samantha J Warrington et al. Development. 2013 Mar.

Abstract

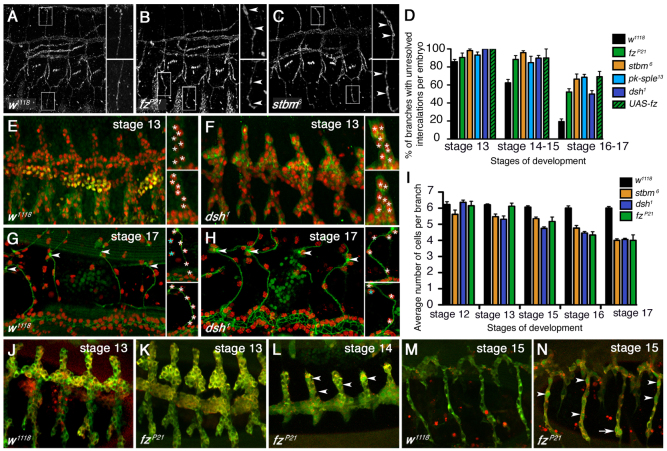
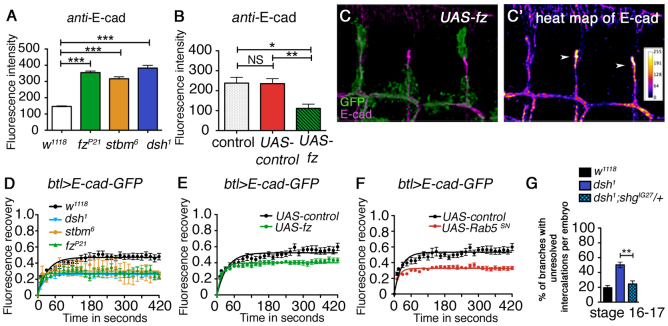
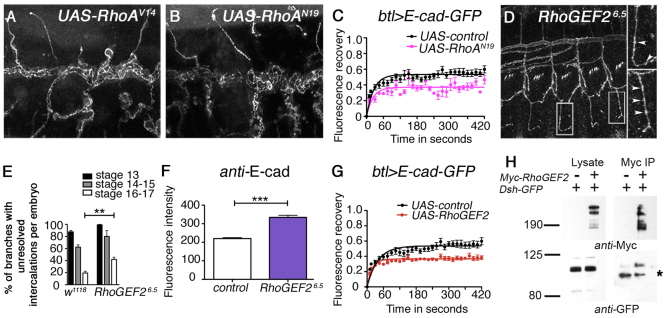
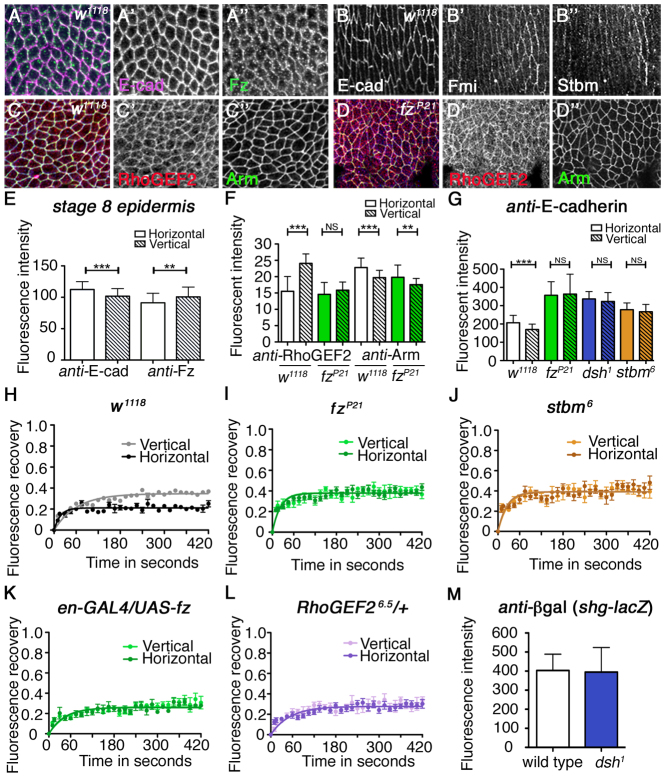
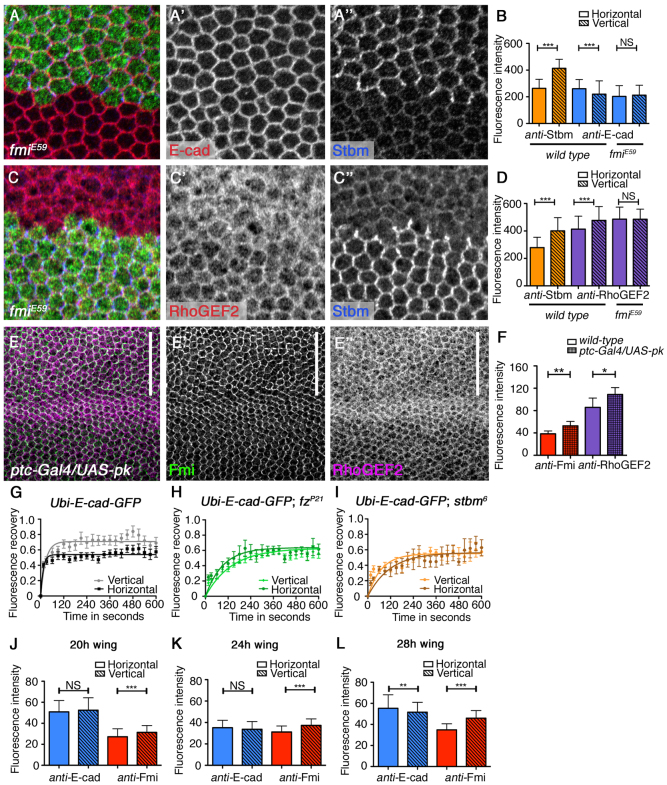
Polarised tissue elongation during morphogenesis involves cells within epithelial sheets or tubes making and breaking intercellular contacts in an oriented manner. Growing evidence suggests that cell adhesion can be modulated by endocytic trafficking of E-cadherin (E-cad), but how this process can be polarised within individual cells is poorly understood. The Frizzled (Fz)-dependent core planar polarity pathway is a major regulator of polarised cell rearrangements in processes such as gastrulation, and has also been implicated in regulation of cell adhesion through trafficking of E-cad; however, it is not known how these functions are integrated. We report a novel role for the core planar polarity pathway in promoting cell intercalation during tracheal tube morphogenesis in Drosophila embryogenesis, and present evidence that this is due to regulation of turnover and levels of junctional E-cad by the guanine exchange factor RhoGEF2. Furthermore, we show that core pathway activity leads to planar-polarised recruitment of RhoGEF2 and E-cad turnover in the epidermis of both the embryonic germband and the pupal wing. We thus reveal a general mechanism by which the core planar polarity pathway can promote polarised cell rearrangements.


Figures

Fig. 1.
Fig. 1.
The core planar polarity pathway is required for cell intercalation in the tracheal branches. (A-C) Lateral view of embryonic tracheal branches at stage 14 showing cell intercalation in Drosophila embryos stained for Crumbs in wild type (w1118) (A) and maternal zygotic mutants for fzP21 (B) and stbm6 (C). Insets show magnified regions of indicated dorsal and ventral branches, arrowheads indicate unresolved intercalations. Anterior is to the left and dorsal up in this and following images. (D) Quantification of the proportion of branches per embryo with unresolved intercalations at indicated stages. ANOVAs were used to compare simultaneously the control (w1118) and the mutant conditions at each stage: stage 13, P=0.0075; stage 14-15, P≤0.0001; stage 16-17, P≤0.0001. (E-H) Embryonic tracheal branches imaged live showing α-Catenin-GFP (green) and NLS-red-stinger (red), under the control of btl-GAL4 in wild type stage 13 (E) and stage 17 (G), and dsh1 stage 13 (F) and stage 17 (H). Insets show magnifications of single branches. White asterisks mark individual nuclei in branches, blue asterisks indicate nuclei from different branches, arrowheads indicate the joining point of the dorsal branch to its reciprocal dorsal branch on the other side of the embryo. (I) Quantification of the number of cells per dorsal branch during cell intercalation. ANOVAs were used to compare the control and the mutant conditions for each stage: stage 12, P=0.078; stage 13, P≤0.0001; stage 15, P≤0.0001; stage 16, P≤0.0001; stage 17, P≤0.0001. (J-N) Live images of branches with cells expressing the Apoliner construct under control of btl-GAL4 in wild type stage 13 (J), fzP21 stage 13 (K), fzP21 stage 14 (L), wild type stage 15 (M) and fzP21 stage 15 (N). Arrowheads mark cells with GFP-positive nuclei. Arrow marks a pair of cells both expressing GFP in the nucleus. Error bars represent s.e.m.
Fig. 2.
Fig. 2.
The core planar polarity pathway controls E-cad levels and turnover in the tracheal branches. (A,B) Intensity measurements of junctional endogenous E-cad in stage 14 tracheal branches in control and core pathway mutant or overexpressing Drosophila embryos. (A) w1118 (control), fzP21, stbm6, dsh1; (B) btl-GAL4 (control), btl-GAL4/UAS-NLS-red-stinger, btl-GAL4/UAS-fz. ANOVAs were used to compare the control and mutant conditions: in A, P≤0.0001; in B, P=0.0002. Asterisks indicate individual results from a Dunnett’s multiple comparison test (NS, not significant; *P≤0.05, **P≤0.01, ***P≤0.0001). (C,C′) Dorsal branches containing clones of cells overexpressing UAS-fz together with UAS-GFP (green) under control of btl>stop>GAL4, labelled for E-cad (magenta in C, or shown as intensity table in C′). E-cad levels are cell-autonomously reduced in cells overexpressing fz (green) compared with non-overexpressing cells (arrowheads). (D) FRAP analysis in dorsal tracheal branches on junctional E-cad-GFP expressed under control of btl-GAL4 in wild-type and core pathway mutant backgrounds. The lower level of fluorescent recovery after bleaching in the mutants indicates the presence of a larger stable fraction of E-cad-GFP compared with wild type (one-way ANOVA comparing stable fractions P≤0.0001). We were unable to determine accurately the half-lives of recovery, as in all genotypes recovery was too rapid compared with the interval between time frames. (E,F) FRAP analysis of E-cad-GFP expressed under control of btl-GAL4 with co-expression of fz (E) or Rab5SN (F). In both cases, there is an increase in the stable fraction of E-cad-GFP compared with the NLS-red-stinger-expressing control (t-test comparing stable fractions P≤0.0001 for both). (G) Quantification of the intercalation phenotype in tracheal branches of dsh1 embryos heterozygous for shgIG27 (the gene coding for E-cad), which is suppressed compared with dsh1 (t-test, **P=0.0016). Error bars represent s.e.m.
Fig. 3.
Fig. 3.
The core planar polarity pathway acts via RhoGEF2 in the tracheal system. (A,B) Lateral view of disrupted tracheal branches stained for Crumbs in Drosophila embryos expressing activated RhoAV14 (A) or dominant-negative RhoAN19 (B) under control of btl-Gal4. (C) FRAP analysis of E-cad-GFP expressed under control of btl-GAL4 with co-expression of RhoN19. There is an increase in the stable fraction of E-cad-GFP compared with the NLS-red-stinger-expressing control (t-test comparing stable fractions, P≤0.0001). (D) Tracheal intercalation defect in embryos heterozygous for the RhoGEF26.5 antimorphic allele stained with Crumbs. Insets show magnifications of single branches, arrowheads indicate unresolved intercalations. (E) Quantification of the intercalation phenotype in embryos heterozygous for the RhoGEF26.5 antimorphic allele. Note similar phenotype to that of the core pathway mutants (see Fig. 1D). A t-test was used to compare w1118 and RhoGEF26.5 at stage 16-17. **P=0.0029. (F) Intensity measurements of junctional E-cad in stage 14 tracheal branches of embryos heterozygous for the RhoGEF26.5 antimorphic allele compared with w1118 control. A t-test was used to determine the statistical significance. ***P≤0.0001. (G) FRAP analysis in dorsal tracheal branches on junctional E-cad-GFP expressed under control of btl-GAL4 with co-expression of UAS-RhoGEF2, showing an increase in the stable fraction of E-cad-GFP compared with the NLS-red-stinger-expressing control (t-test comparing stable fractions, P≤0.0001). (H) Immunoprecipitation of Myc-RhoGEF2 from Drosophila S2 cells, showing co-precipitation of Dsh-GFP. Asterisk indicates non-specific band seen in pull-down. Error bars represent s.e.m.
Fig. 4.
Fig. 4.
The core planar polarity pathway regulates planar-polarised distribution of E-cad in the embryonic epidermis. (A-A″) Image of ventrolateral epidermis in a stage 8 Drosophila embryo labelled for E-cad (magenta in A, white in A′) and Fz (green in A, white in A″). (B-B″) Localisation of E-cad (B), Fmi (B′) and Stbm (B″) in stage 15 epidermis. (C-D″) Localisation of RhoGEF2 (red or white) and Arm (green or white) in ventrolateral epidermis of wild-type (C) or fzP21 (D) stage 8 embryos. (E) Quantification of junctional E-cad and Fz levels on vertical and horizontal junctions in the ventrolateral epidermis of stage 8 wild-type embryos (t-test for E-cad, ***P≤0.0001 and for Fz, **P=0.0035). Error bars are s.d. (F) Quantification of junctional asymmetry for RhoGEF2 and Arm in stage 8 epidermis in wild-type embryos (white) and fzP21 embryos (green). t-tests were used to compare horizontal and vertical intensities, RhoGEF2 in w1118 (wild type), ***P≤0.0001 and in fzP21, P=0.26; Arm in w1118, ***P≤0.0001 and in fzP21, **P=0.0035. Error bars are s.d. (G) Quantification of junctional E-cad in stage 8 epidermis in wild-type embryos (white) and fzP21 (green), dsh1 (blue) or stbm6 (orange). Intensity of E-cad increases in polarity mutants and E-cad asymmetry is lost. Asterisks show individual results from a Bonferroni multiple comparison test (NS, not significant; *P≤0.05, **P≤0.01, ***P≤0.0001). Error bars are s.d. An ANOVA comparing just the horizontal intensity values of mutants to wild type gives P≤0.0001. (H-L) FRAP analysis in the epidermis of junctional E-cad-GFP expressed under control of the ubiquitin promoter in w1118 (wild-type; H) embryos (P≤0.0001 comparing stable fractions on vertical and horizontal junctions using t-test), fzP21 (I; P=0.28), stbm6 (J; P=0.13), en-GAL4/UAS-fz (K; P=0.064) and RhoGEF26.5/+ antimorphs (L; P=0.084). (M) Quantification of βgal labelling showing levels of transcription from shg-lacZ (an enhancer trap in the locus encoding E-cad) (Shindo et al., 2008) in wild-type and dsh1 epidermal cells (t-test, P=0.90). Error bars are s.d.
Fig. 5.
Fig. 5.
The core planar polarity pathway regulates planar-polarised distribution of E-cad in the pupal wing. (A-A″) E-cad (red in A, white in A′) and Stbm (blue in A, white in A″) in a fmiE59 pupal wing clone marked by absence of lacZ expression (green in A). Distal to the right. (B) Quantification of endogenous junctional E-cad (blue) in wild type and fmiE59, and of Stbm (orange) in wild-type 28-hour pupal wings. E-cad is increased on the horizontal junctions in wild-type tissue but this is lost in fmiE59 mutant cells (t-tests comparing horizontal and vertical intensities: Stbm in wild type, ***P≤0.0001; E-cad in wild type, ***P=0.0004; E-cad in fmiE59, P=0.3623). Error bars are s.d. (C-C″) RhoGEF2 (red in C, white in C′) and Stbm (blue in C, white in C″) in a fmiE59 pupal wing clone marked by absence of lacZ expression (green in C). Specificity of the RhoGEF2 immunolabelling was confirmed using RNAi knockdown (see supplementary material Fig. S4E). (D) Quantification of endogenous junctional RhoGEF2 (purple) in wild type and fmiE59, and of Stbm (orange) in wild-type 28-hour pupal wings. RhoGEF2 is increased on the vertical junctions in wild-type tissue but this is lost in fmiE59 mutant cells (t-tests comparing horizontal and vertical intensities: Stbm in wild type, ***P≤0.0001; RhoGEF2 in wild type, ***P≤0.0001; RhoGEF2 in fmiE59, P=0.9593). Error bars are s.d. (E-E″) Pupal wing overexpressing Pk under control of the ptc-GAL4 driver between veins 3 and 4 (region indicated by white bar) immunolabelled for Fmi (green in E, white in E′) and RhoGEF2 (magenta in E, white in E″). (F) Quantification of Fmi (red) and RhoGEF2 (purple) in wild-type and Pk-overexpressing tissue. Asterisks correspond to t-tests of mean intensity of a large region in the ptc-Gal4 expression domain compared with a wild-type region in the same wing (Fmi, **P=0.0042; RhoGEF2 *P=0.0388. Error bars are s.d.). (G-I) FRAP analysis of junctional E-cad-GFP expressed under the ubiquitin promoter in 28-hour pupal wings, showing a difference between vertical and horizontal junctions in wild type (G; t-test P≤0.0001), this difference is lost in fzP21 (H; t-test P=0.79) and stbm6 (I; t-test P=0.36). Note that there is also an increase in the half-life of E-cad-GFP fluorescence recovery in the absence of core protein activity, again consistent with a role of core proteins in promoting E-cad turnover. (J-L) Quantification of endogenous junctional E-cad (blue) and Fmi (red) asymmetry in pupal wings at 20 hours (J), 24 hours (K) and 28 hours (L). t-tests comparing horizontal and vertical intensities, *P≤0.05, **P≤0.01, ***P≤0.0001. Error bars are s.d. NS, not significant.

Similar articles

Cited by

References

    1. Affolter M., Zeller R., Caussinus E. (2009). Tissue remodelling through branching morphogenesis. Nat. Rev. Mol. Cell Biol. 10, 831–842 - PubMed
    1. Aigouy B., Farhadifar R., Staple D. B., Sagner A., Röper J.-C., Jülicher F., Eaton S. (2010). Cell flow reorients the axis of planar polarity in the wing epithelium of Drosophila. Cell 142, 773–786 - PubMed
    1. Baer M. M., Bilstein A., Caussinus E., Csiszar A., Affolter M., Leptin M. (2010). The role of apoptosis in shaping the tracheal system in the Drosophila embryo. Mech. Dev. 127, 28–35 - PubMed
    1. Bardet P. L., Kolahgar G., Mynett A., Miguel-Aliaga I., Briscoe J., Meier P., Vincent J. P. (2008). A fluorescent reporter of caspase activity for live imaging. Proc. Natl. Acad. Sci. USA 105, 13901–13905 - PMC - PubMed
    1. Bastock R., Strutt D. (2007). The planar polarity pathway promotes coordinated cell migration during Drosophila oogenesis. Development 134, 3055–3064 - PMC - PubMed

Publication types

MeSH terms

LinkOut - more resources