. 2013 May;7(5):922-36.
doi: 10.1038/ismej.2012.166. Epub 2013 Jan 31.

A global perspective on marine photosynthetic picoeukaryote community structure

Affiliations

A global perspective on marine photosynthetic picoeukaryote community structure

Amy R Kirkham et al. ISME J. 2013 May.

Abstract

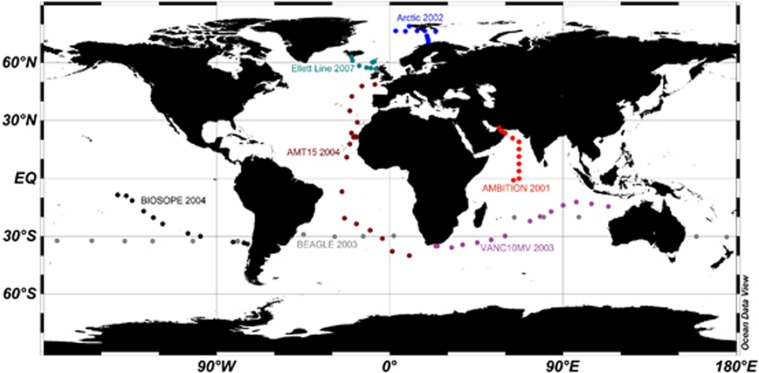
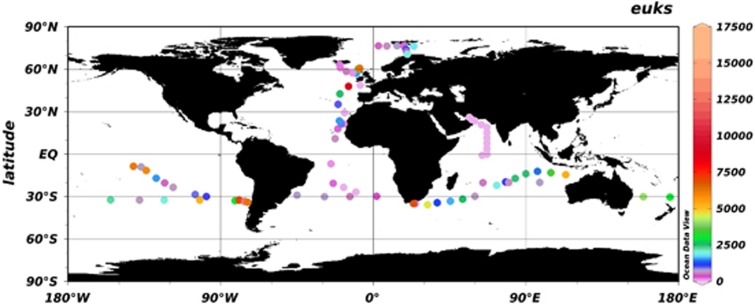
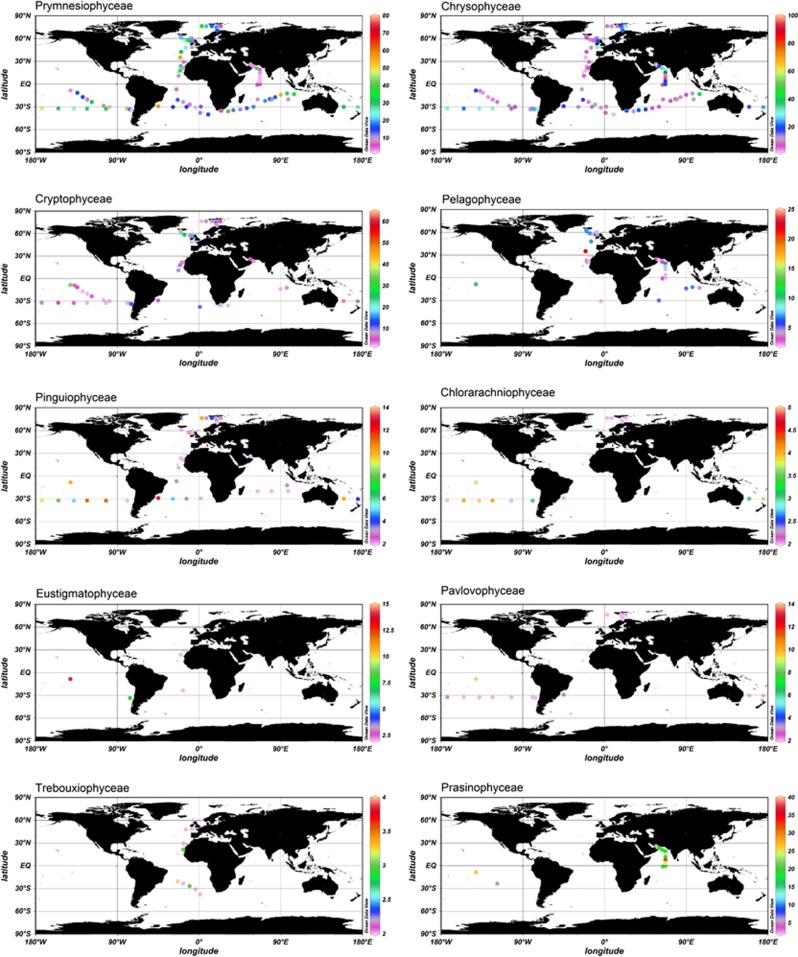
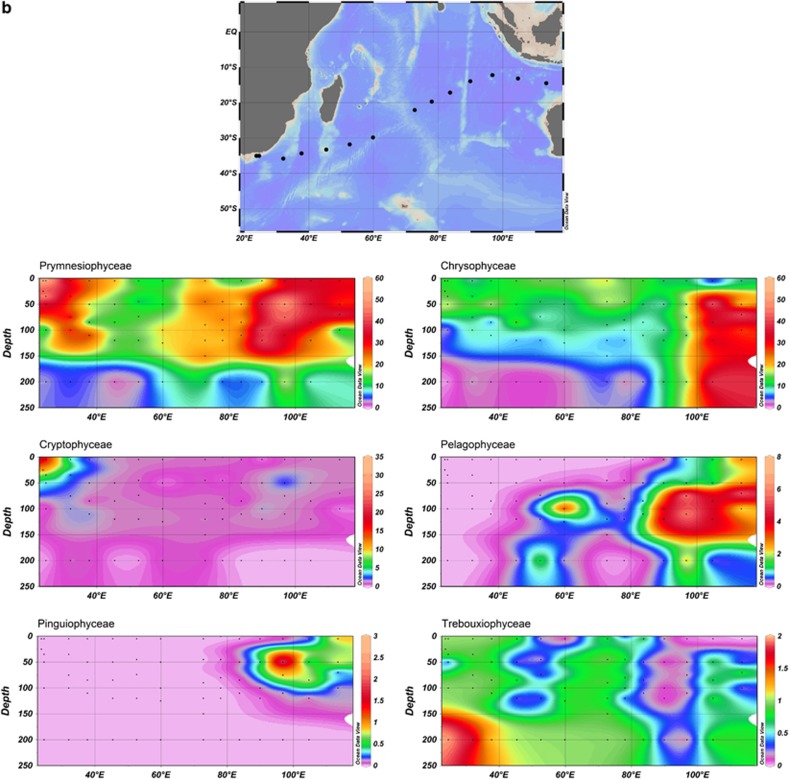
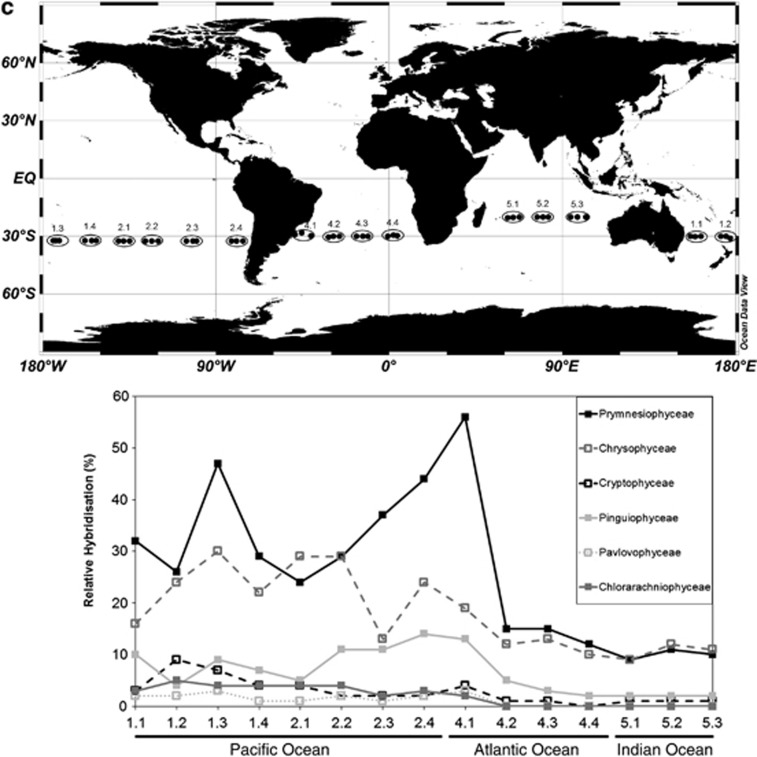
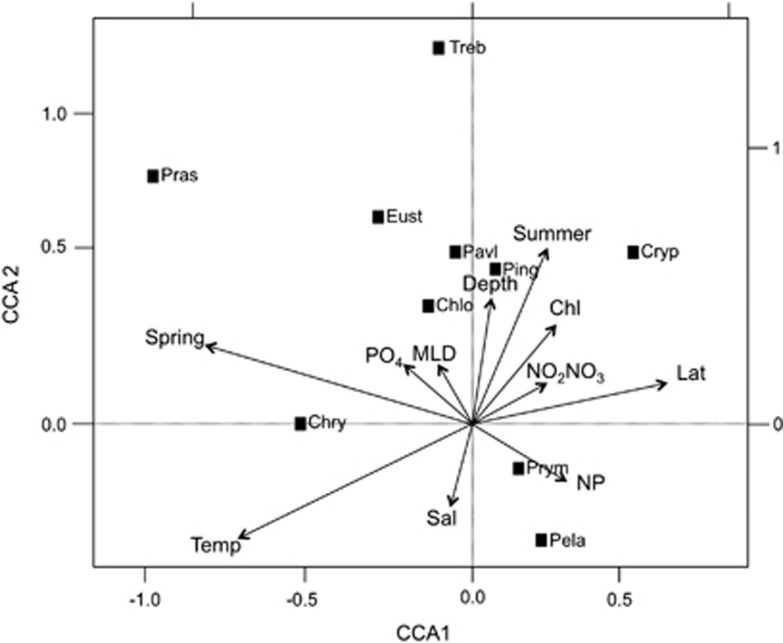
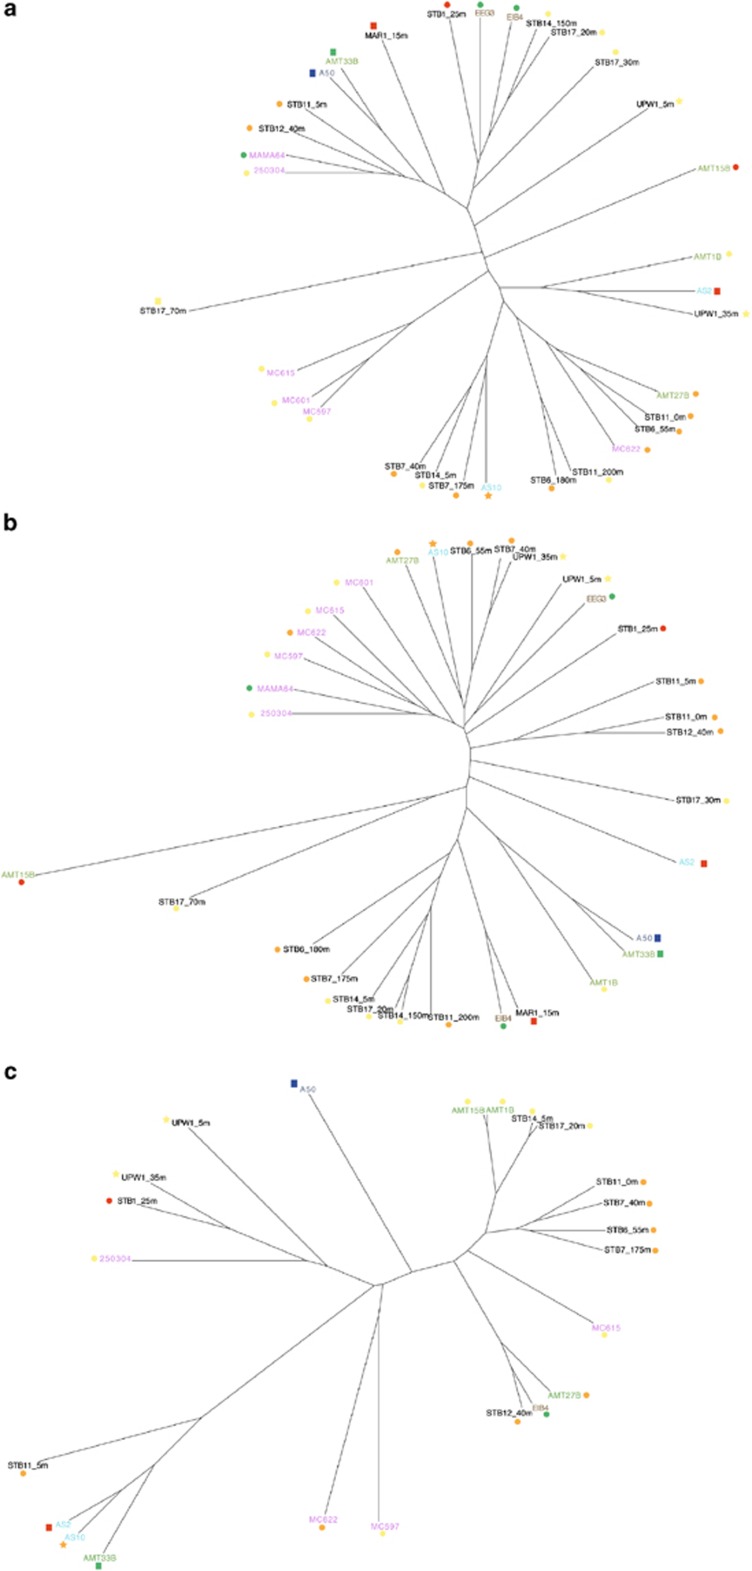
A central goal in ecology is to understand the factors affecting the temporal dynamics and spatial distribution of microorganisms and the underlying processes causing differences in community structure and composition. However, little is known in this respect for photosynthetic picoeukaryotes (PPEs), algae that are now recognised as major players in marine CO2 fixation. Here, we analysed dot blot hybridisation and cloning-sequencing data, using the plastid-encoded 16S rRNA gene, from seven research cruises that encompassed all four ocean biomes. We provide insights into global abundance, α- and β-diversity distribution and the environmental factors shaping PPE community structure and composition. At the class level, the most commonly encountered PPEs were Prymnesiophyceae and Chrysophyceae. These taxa displayed complementary distribution patterns, with peak abundances of Prymnesiophyceae and Chrysophyceae in waters of high (25:1) or low (12:1) nitrogen:phosphorus (N:P) ratio, respectively. Significant differences in phylogenetic composition of PPEs were demonstrated for higher taxonomic levels between ocean basins, using Unifrac analyses of clone library sequence data. Differences in composition were generally greater between basins (interbasins) than within a basin (intrabasin). These differences were primarily linked to taxonomic variation in the composition of Prymnesiophyceae and Prasinophyceae whereas Chrysophyceae were phylogenetically similar in all libraries. These data provide better knowledge of PPE community structure across the world ocean and are crucial in assessing their evolution and contribution to CO2 fixation, especially in the context of global climate change.


Figures

Figure 1
Figure 1
Schematic representation of the cruise tracks analysed in this study.
Figure 2
Figure 2
Global distribution patterns of PPE abundances, at all depths sampled, determined by flow cytometry.
Figure 3
Figure 3
Global distribution patterns of specific PPE classes, at all depths sampled, as determined by dot blot hybridisation analysis.
Figure 4
Figure 4
Dot blot hybridisation data showing the distribution of specific PPE classes along (a) the Arctic Ocean transect, plotted by longitude (left) and latitude (right), (b) along the Indian Ocean transect and (c) along the BEAGLE transect, encompassing samples taken in surface waters of the Pacific Ocean, Atlantic Ocean and Indian Ocean. The three dots in red circle correspond to three CTDs from where DNA was pooled. Contour plots (a, b) indicate the percent relative hybridisation (as a proportion of all products amplified by primers PLA491F and OXY1313R). The y-axes plot the depth (m) down each water column, and the x-axes plot the distance along the cruise by longitude (left) and latitude (right). Black dots represent sampling points.
Figure 4
Figure 4
Dot blot hybridisation data showing the distribution of specific PPE classes along (a) the Arctic Ocean transect, plotted by longitude (left) and latitude (right), (b) along the Indian Ocean transect and (c) along the BEAGLE transect, encompassing samples taken in surface waters of the Pacific Ocean, Atlantic Ocean and Indian Ocean. The three dots in red circle correspond to three CTDs from where DNA was pooled. Contour plots (a, b) indicate the percent relative hybridisation (as a proportion of all products amplified by primers PLA491F and OXY1313R). The y-axes plot the depth (m) down each water column, and the x-axes plot the distance along the cruise by longitude (left) and latitude (right). Black dots represent sampling points.
Figure 5
Figure 5
Canonical correspondence analysis plot using relative hybridisation values (%) detected for all cruises except the Indian Ocean transect. PPE classes are as follows: Prymnesiophyceae (Prym), Chrysophyceae (Chry), Cryptophyceae (Cryp), Pinguiophyceae (Ping), Pelagophyceae (Pela), Eustigmatophyceae (Eust) and Trebouxiophyceae (Treb). Variables are season: length of time from autumn equinox (Spring), season: length of time from winter solstice (Summer), chlorophyll a (Chl), phosphate (PO4), nitrate+nitrite concentration (NO2NO3), nitrate+nitrite:phosphate ratio (NP), salinity (Sal), depth (Depth), mixed layer depth (MLD), latitude (Lat) and temperature (Temp). The x-axis explains 9.3% and the y-axis explains 3.8% of the variation in dot blot hybridisation data.
Figure 6
Figure 6
Unifrac analysis illustrating the genetic similarity of clone libraries based on sequences related to (a) all PPE classes, (b) Prymnesiophyceae and (c) Chrysophyceae. Coloured symbols illustrate the temperature and trophic status of the samples from which clone libraries were constructed. Circle, oligotrophic (Phosphate concentration <10 mg m−3); square, mesotrophic (Phosphate concentration 10–20 mg m−3); star, eutrophic (Phosphate concentration >20 mg m−3); blue, very low temperature (<10 °C); green, low temperature (10–14.99 °C); yellow, medium temperature (15–19.99 °C); orange, high temperature (20–24.99 °C); red, very high temperature (⩾25 °C).

References

    1. Andersen RA. Biology and systematics of heterokont and haptophyte algae. Am J Bot. 2004;10:1508–1522. - PubMed
    1. Arrigo KR, Robinson DH, Worthen DL, Dunbar RB, DiTullio GR, VanWoert M, et al. Phytoplankton community structure and the drawdown of nutrients and CO2 in the Southern Ocean. Science. 1999;283:365–367. - PubMed
    1. Arrigo KR. Marine microorganisms and global nutrient cycles. Nature. 2005;437:349–355. - PubMed
    1. Bouman HA, Lepère C, Scanlan DJ, Ulloa O. Phytoplankton community structure in a high-nutrient, low-chlorophyll region of the eastern Pacific Subantarctic region during winter-mixed and summer-stratified conditions. Deep Sea Res I. 2012;69:1–11.
    1. Bouman HA, Ulloa O, Scanlan DJ, Zwirglmaier K, Li WK, Platt T, et al. Oceanographic basis of the global surface distribution of Prochlorococcus ecotypes. Science. 2006;312:918–921. - PubMed

Publication types

Substances

LinkOut - more resources