

Reduced c-Fos expression in medullary catecholaminergic neurons in rats 20 h after exposure to chronic intermittent hypoxia
- PMID: 23364524
- PMCID: PMC3627945
- DOI: 10.1152/ajpregu.00542.2012
Reduced c-Fos expression in medullary catecholaminergic neurons in rats 20 h after exposure to chronic intermittent hypoxia
Abstract
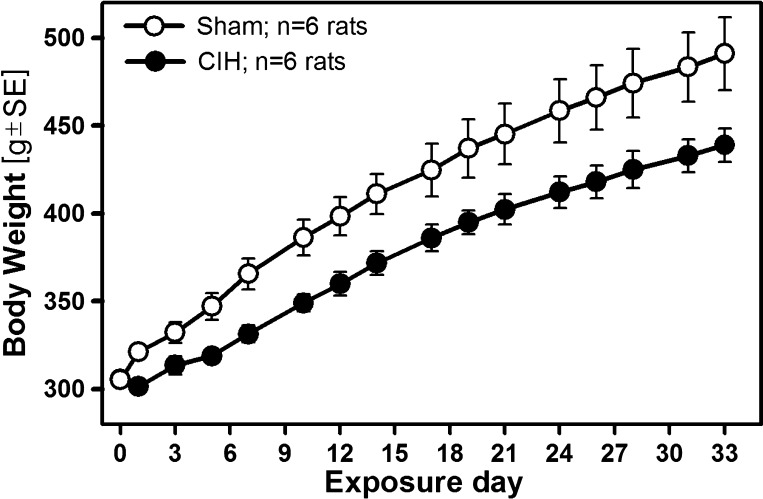
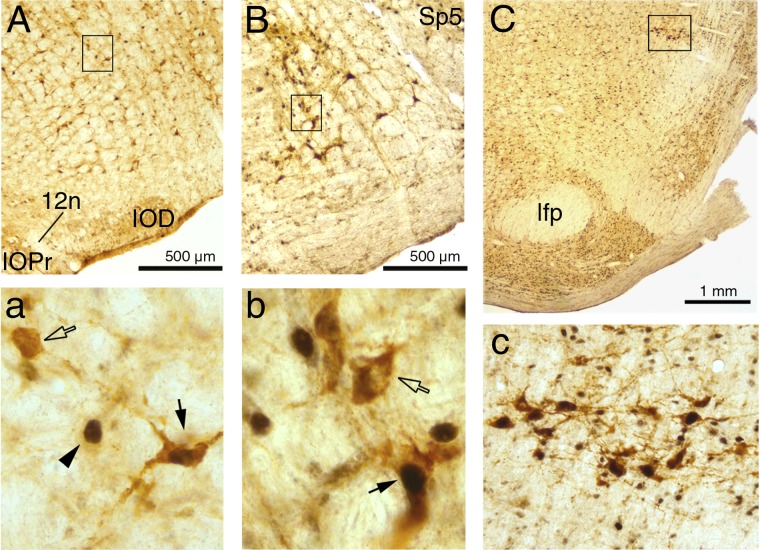
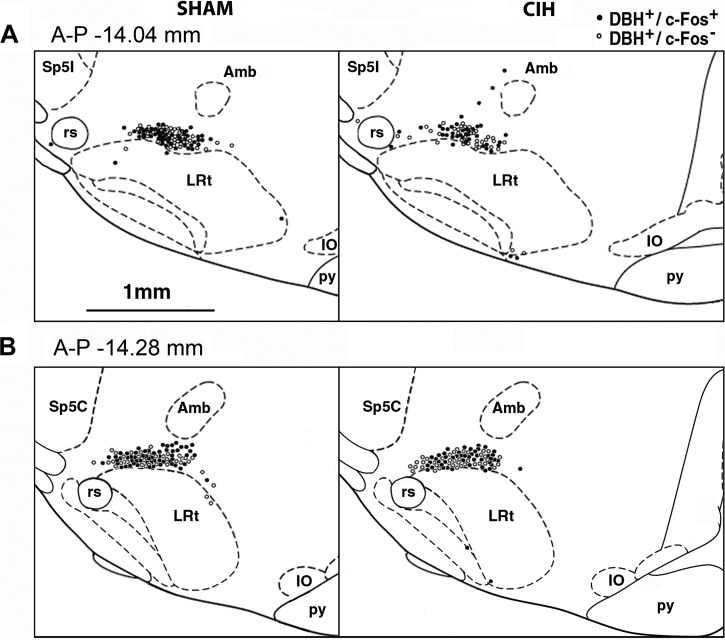
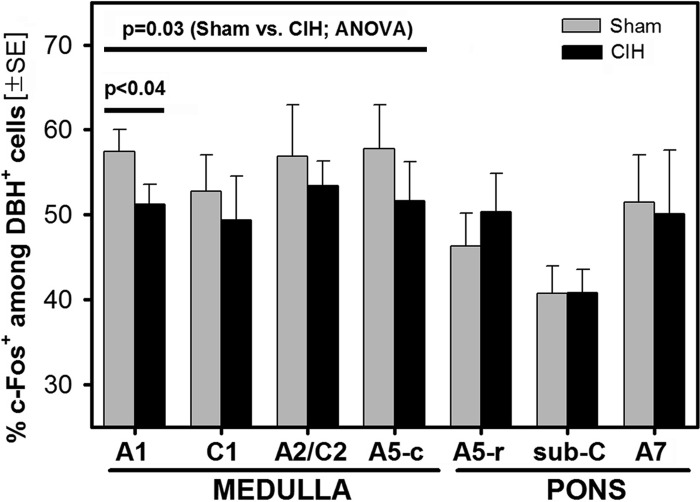
Persons affected by obstructive sleep apnea (OSA) have increased arterial blood pressure and elevated activity in upper airway muscles. Many cardiorespiratory features of OSA have been reproduced in rodents subjected to chronic-intermittent hypoxia (CIH). We previously reported that, following exposure to CIH, rats have increased noradrenergic terminal density in brain stem sensory and motor nuclei and upregulated expression of the excitatory α(1)-adrenergic receptors in the hypoglossal motor nucleus. This suggested that CIH may enhance central catecholaminergic transmission. We now quantified c-Fos expression in different groups of pontomedullary catecholaminergic neurons as an indirect way of assessing their baseline activity in rats subjected to CIH or sham treatment (7 AM-5 PM daily for 35 days). One day after the last CIH exposure, the rats were gently kept awake for 2.5 h and then were anesthetized and perfused, and their pontomedullary brain sections were subjected to dopamine β-hydroxylase (DBH) and c-Fos immunohistochemistry. DBH-positive cells were counted in the A1/C1, A2/C2, A5, subcoeruleus (sub-C) and A7 groups of catecholaminergic neurons, and the percentages of those expressing c-Fos were determined. We found that fewer DBH cells expressed c-Fos in CIH- than in sham-treated rats in the medulla (significant in the A1 group). In the pons (rostral A5, sub-C, and A7), c-Fos expression did not differ between the CIH- and sham-treated animals. We suggest that, when measured 20 h after the last CIH exposure, catecholaminergic transmission is enhanced through terminal sprouting and receptor upregulation rather than through increased baseline activity in pontomedullary catecholaminergic neurons.
Figures
Similar articles
-
Fos expression in pontomedullary catecholaminergic cells following rapid eye movement sleep-like episodes elicited by pontine carbachol in urethane-anesthetized rats.Neuroscience. 2008 Mar 3;152(1):208-22. doi: 10.1016/j.neuroscience.2007.11.013. Neuroscience. 2008. PMID: 18155849 Free PMC article.
-
Flurothyl-induced seizures in rats activate Fos in brainstem catecholaminergic neurons.Epilepsy Res. 2000 Mar;39(1):1-12. doi: 10.1016/s0920-1211(99)00106-0. Epilepsy Res. 2000. PMID: 10690748
-
Fos expression in A1/C1 neurons of rats exposed to hypoxia, hypercapnia, or hypercapnic hypoxia.Neurosci Lett. 2024 Nov 20;843:138024. doi: 10.1016/j.neulet.2024.138024. Epub 2024 Oct 22. Neurosci Lett. 2024. PMID: 39442648
-
Hypoxia-induced Fos expression in neurons projecting to the pressor region in the rostral ventrolateral medulla.Neuroscience. 1997 Oct;80(4):1209-24. doi: 10.1016/s0306-4522(97)00111-5. Neuroscience. 1997. PMID: 9284071
-
Intermittent severe hypoxia induces plasticity within serotonergic and catecholaminergic neurons in the neonatal rat ventrolateral medulla.J Appl Physiol (1985). 2016 Jun 1;120(11):1277-87. doi: 10.1152/japplphysiol.00048.2016. Epub 2016 Mar 10. J Appl Physiol (1985). 2016. PMID: 26968026 Free PMC article.
Cited by
-
PACAP-PAC1 Receptor Activation Is Necessary for the Sympathetic Response to Acute Intermittent Hypoxia.Front Neurosci. 2019 Aug 21;13:881. doi: 10.3389/fnins.2019.00881. eCollection 2019. Front Neurosci. 2019. PMID: 31496933 Free PMC article.
-
Sex differences in body temperature and neural power spectra in response to repeated restraint stress.Stress. 2024 Jan;27(1):2320780. doi: 10.1080/10253890.2024.2320780. Epub 2024 Feb 28. Stress. 2024. PMID: 38414377 Free PMC article.
-
Identification of novel biomarkers in obstructive sleep apnea via integrated bioinformatics analysis and experimental validation.PeerJ. 2023 Dec 4;11:e16608. doi: 10.7717/peerj.16608. eCollection 2023. PeerJ. 2023. PMID: 38077447 Free PMC article.
-
Sleep-disordered breathing: effects on brain structure and function.Respir Physiol Neurobiol. 2013 Sep 15;188(3):383-91. doi: 10.1016/j.resp.2013.04.021. Epub 2013 May 1. Respir Physiol Neurobiol. 2013. PMID: 23643610 Free PMC article. Review.
-
Transcription factors regulate GPR91-mediated expression of VEGF in hypoxia-induced retinopathy.Sci Rep. 2017 Apr 4;7:45807. doi: 10.1038/srep45807. Sci Rep. 2017. PMID: 28374767 Free PMC article.
References
-
- Buller KM, Smith DW, Day TA. NTS catecholamine cell recruitment by hemorrhage and hypoxia. Neuro Report 10: 3853–3856, 1999 - PubMed
-
- Cano-Pumarega I, Durán-Cantolla J, Aizpuru F, Miranda-Serrano E, Rubio R, Martínez-Null C, de MJ, Egea C, Cancelo L, Álvarez A, Fernández-Bolaños M, Barbé F. Obstructive sleep apnea and systemic hypertension: longitudinal study in the general population: the Vitoria Sleep Cohort. Am J Respir Crit Care Med 184: 1299–1304, 2011 - PubMed
-
- Choi JB, Loredo JS, Norman D, Mills PJ, Ancoli-Israel S, Ziegler MG, Dimsdale JE. Does obstructive sleep apnea increase hematocrit? Sleep Breath 10: 155–160, 2006 - PubMed
Publication types
MeSH terms
Substances
Grants and funding
LinkOut - more resources
Full Text Sources
Other Literature Sources
Miscellaneous