. 2013 Feb 15;216(Pt 4):641-55.
doi: 10.1242/jeb.077453.

Collision-avoidance behaviors of minimally restrained flying locusts to looming stimuli

Affiliations

Collision-avoidance behaviors of minimally restrained flying locusts to looming stimuli

R W M Chan et al. J Exp Biol. .

Abstract

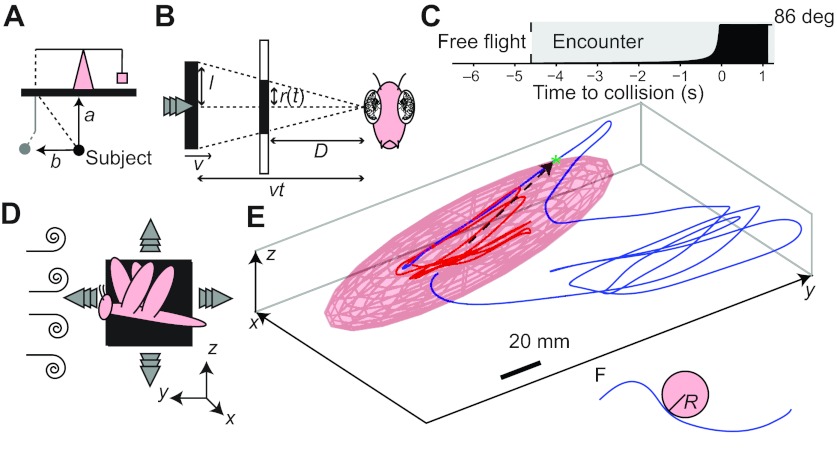
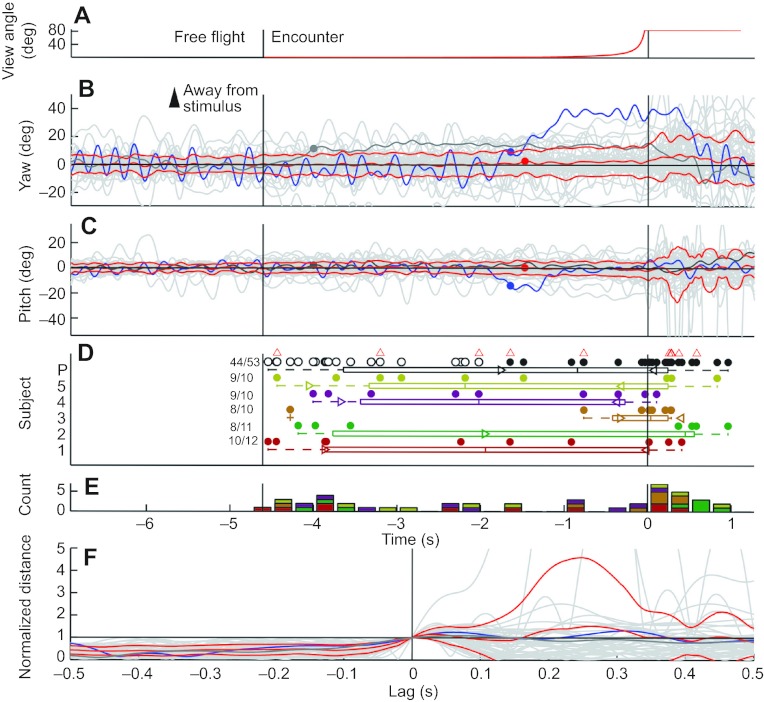
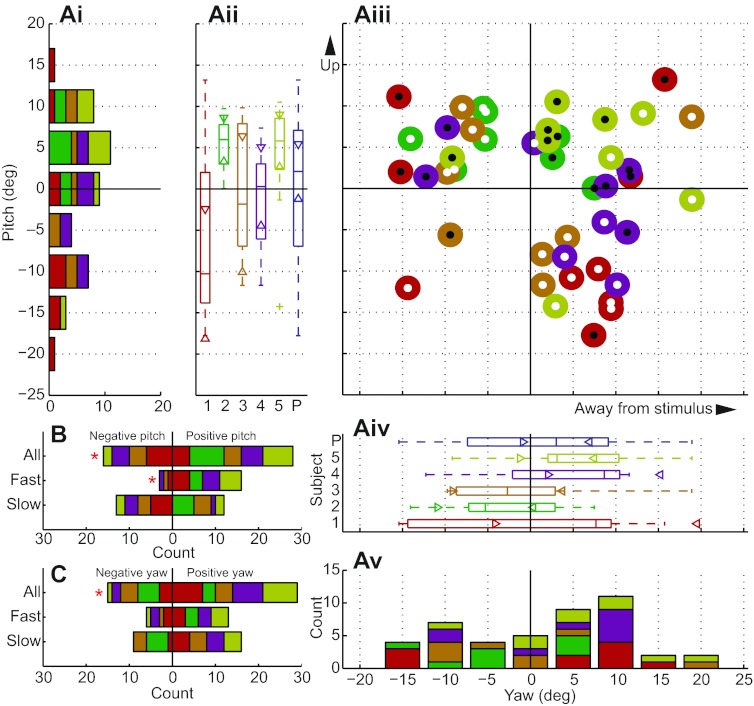
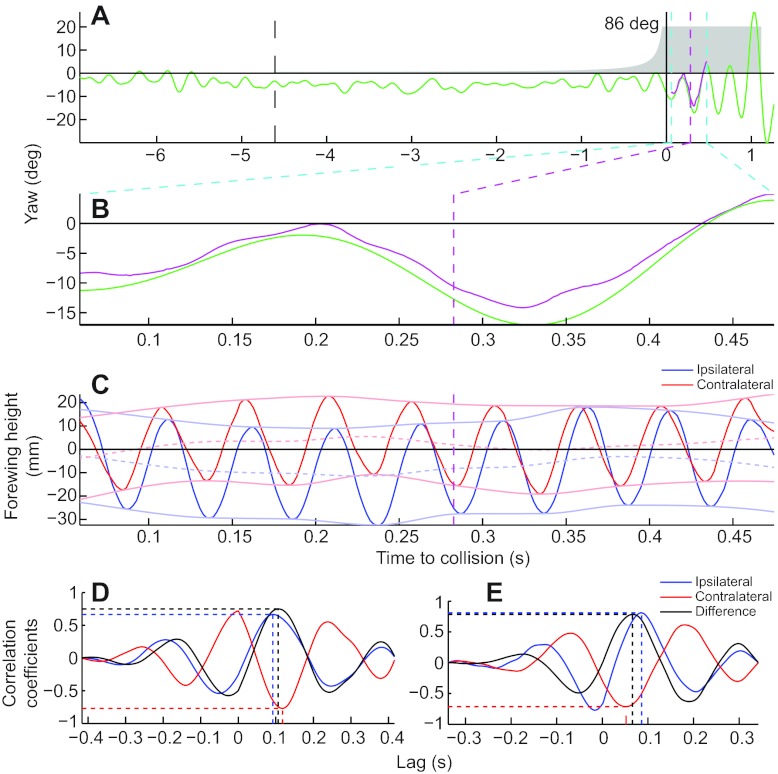
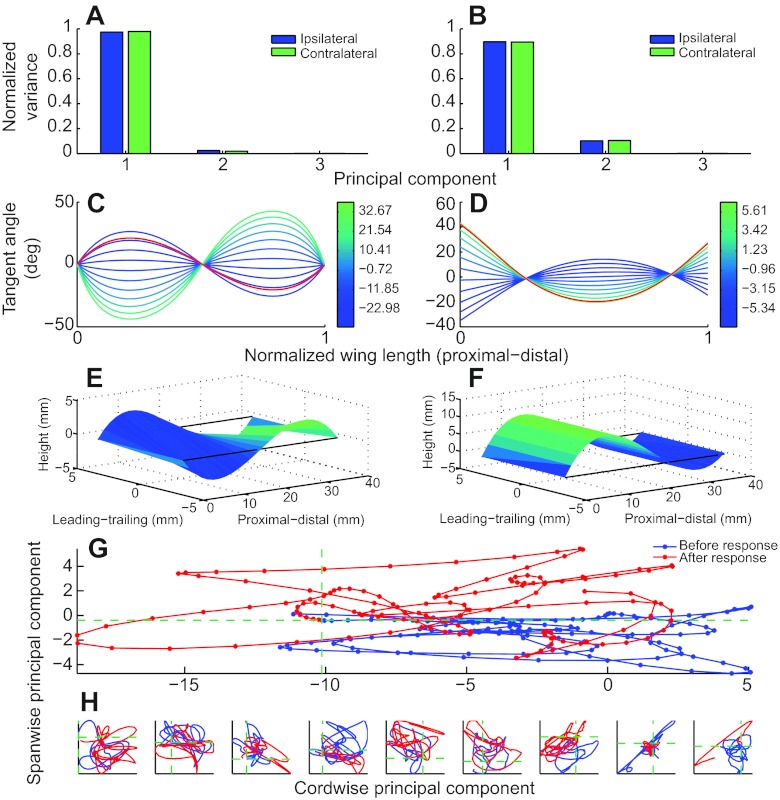
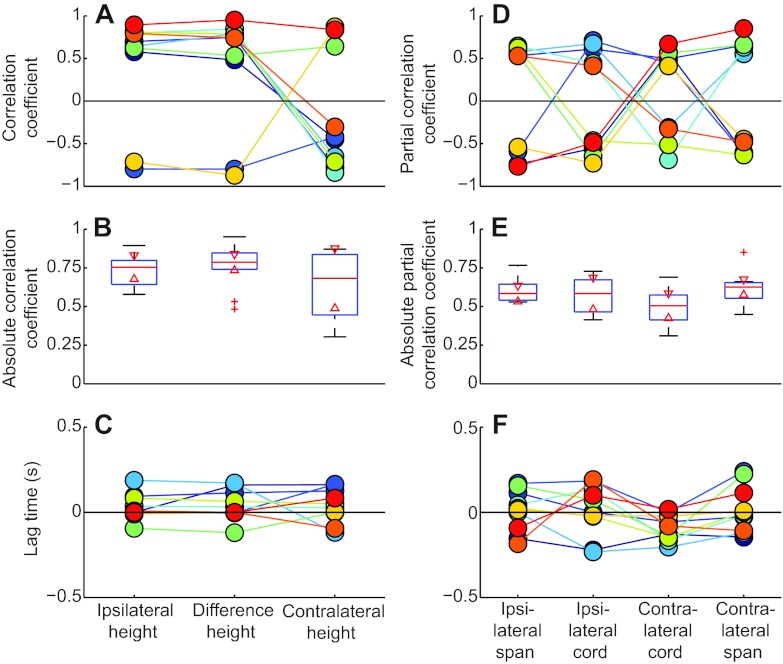
Visually guided collision avoidance is of paramount importance in flight, for instance to allow escape from potential predators. Yet, little is known about the types of collision-avoidance behaviors that may be generated by flying animals in response to an impending visual threat. We studied the behavior of minimally restrained locusts flying in a wind tunnel as they were subjected to looming stimuli presented to the side of the animal, simulating the approach of an object on a collision course. Using high-speed movie recordings, we observed a wide variety of collision-avoidance behaviors including climbs and dives away from - but also towards - the stimulus. In a more restrained setting, we were able to relate kinematic parameters of the flapping wings with yaw changes in the trajectory of the animal. Asymmetric wing flapping was most strongly correlated with changes in yaw, but we also observed a substantial effect of wing deformations. Additionally, the effect of wing deformations on yaw was relatively independent of that of wing asymmetries. Thus, flying locusts exhibit a rich range of collision-avoidance behaviors that depend on several distinct aerodynamic characteristics of wing flapping flight.


Figures

Fig. 1.
Fig. 1.
Experimental setup, stimulus and definition of collision-avoidance behavior. (A) Schematic diagrams of the counter-weight system positioned on top of the wind tunnel. The black dashed line below the wind tunnel top (thick black horizontal line) represent the subject and long thread in the ‘loose-tether’ condition. The vectors a and b indicate the direction of vertical and horizontal force, respectively. The gray circle, and the gray solid and dashed lines represent the subject, rigid tube and short thread, respectively, in the ‘tight tether’ condition (not drawn to scale). (B) The (virtual) object, a black square with half-height l, approaches the locust’s eye at a velocity v. Time to collision is denoted by t (<0 before collision) and the object’s velocity by v (<0 for an approaching object). The distance from the eye is vt. Instead of using a real object, a looming stimulus was constructed by projecting the object’s profile on a screen at a distance D from the eye. The looming stimulus half-height is given by r(t)=(l/v)(D/t). The time-varying position of the animal was taken into account as described in Materials and methods. (C) Time course of an example trial. There is no stimulus during the ‘free-flight’ epoch. The looming stimulus begins at the onset of the ‘encounter’ epoch (grey). Black shading denotes the time course of the stimulus angular size, from 0 to 86 deg. (D) Seen from the side, the looming stimulus appears as an expanding square where the triple arrowheads indicate the direction of expansion. The coordinate system used to track trajectories in three dimensional (3D) space has its x-axis in the direction of the object’s velocity, its y-axis in the direction of flight and its z-axis pointing upwards. The wind direction is in the opposite direction to flight and is represented by the swirls. (E) Reconstructed 3D trajectory of a locust in loose-tether flight. The red trace is free flight while the blue trace is flight during the encounter epoch. The pink ellipsoid is twice as large as the smallest ellipsoid confining the free-flight trajectory (doubled confinement ellipsoid, DCE; see Materials and methods). The onset of the collision-avoidance behavior is determined by the point at which the trajectory exits the pink ellipsoid, called the exit point. The response point (green asterisk) is the point immediately preceding the exit point where curvature takes a local maximum (see F). The direction of the collision-avoidance behavior is shown by the dashed black arrow from the centroid of the free-flight data to the exit point of the collision-avoidance behavior (supplementary material Movie 1). (F) Geometrical illustration of the curvature κ=1/R, where R is the radius of the circle tangent to the curve at a given point.
Fig. 2.
Fig. 2.
Free-flight ellipsoid statistics, pooled across six subjects and 115 trials (loose tether). (A) Distributions of confinement ellipsoid centers across all trials. Color indicates subject as shown in B. (B) Distribution of axis 1 (the longest ellipsoid axis) sizes for each subject. The pooled distribution across all subjects (P) is in black. Box plotting conventions, including the significance of triangles, crosses and outer whiskers, are given in ‘Statistical methods’ (see Materials and methods). (C) Distribution of axis directions pooled across all trials. Azimuth is measured relative to the wind incoming direction and elevation relative to the horizontal. Axis 1, the longest ellipsoid axis, is oriented laterally; axis 2, the mid-length ellipsoid axis, is oriented in the wind direction; axis 3, the shortest ellipsoid axis, is oriented vertically. Large circles with white crosses indicate the mean direction for that axis, while the ellipses represent the standard deviation.
Fig. 3.
Fig. 3.
Collision-avoidance behavior trajectories and onset times pooled across six subjects and 115 trials (loose tether). (A–D) Angle subtended by the stimulus as well as flight trajectory in x, y and z directions relative to the confinement ellipsoid center for each trial (gray traces). The blue trace shows the prototypical fast escape trial from Fig. 1, with the blue circle in B–D representing the onset of the collision-avoidance behavior (response time). The dark gray traces similarly illustrate a slow escape trial. The red traces show mean view angle and trajectory as well as its standard deviation bounds (averaged over the 115 individual trajectories). The red circle represents the onset of the collision-avoidance behavior, computed from this mean trajectory. (E) Normalized distance (ND, see ‘Collision-avoidance behavior analysis’ in Materials and methods) from the DCE center temporally aligned with the exit point. Once again, the blue trace shows the prototypical trial from Fig. 1 and the red traces show the mean trajectory and its standard deviation bounds. (F) Box plot statistics for the response times of collision-avoidance behaviors with single data points shown as circles. Outlined and solid black circles are the distribution pooled over all subjects divided into fast and slow responses, respectively. The other colors represent the distributions of individual subjects. Numbers to the left represent positive responses over the total number of trials. See ‘Statistical methods’ (Materials and methods) for box plotting conventions. (G) Histogram of onset times for the collision-avoidance behavior in bins of 250 ms. Colors represent subjects as in F.
Fig. 4.
Fig. 4.
Collision-avoidance behavior directions, pooled across six subjects and 115 trials (loose tether). (A) Distribution of azimuths and elevations for the directions of all collision-avoidance behaviors. (Ai,v) Histograms of the elevation and azimuth, respectively, for all response directions (10 deg bins). (Aii,iv) Box plots of elevation and azimuth, respectively, for all response directions. See ‘Statistical methods’ (Materials and methods) for box plotting conventions; colors and notation as in Fig. 3. (Aiii) Two-dimensional (2D) distribution of azimuth and elevation for all response directions. Responses marked with a white and black central circle correspond to fast and slow responses, respectively. (B,C) Histograms of elevation and azimuth, respectively, for slow, fast and all response directions, binned into positive and negative angles.
Fig. 5.
Fig. 5.
Collision-avoidance behavior trajectories and onset times pooled across five subjects and 53 trials (tight tether; subjects different from those used in loose-tether experiments). (A–C) Angle subtended by the stimulus as well as flight orientation in terms of yaw and pitch for each trial (gray traces). The blue trace shows a prototypical slow escape trial with the blue circle in B and C representing the onset of the collision-avoidance behavior (supplementary material Movie 2). The dark gray trace similarly illustrates a fast escape trial. The red traces show the view angle and the mean trajectory as well as its standard deviation bounds (average of the 53 individual trajectories). The red circle represents the onset of the collision-avoidance behavior, computed from its mean trajectory. (D) Box plot statistics for the onset times of the collision-avoidance behaviors with single data points shown as circles. Outlined and solid black circles are the distribution pooled over all subjects divided into fast (19/44) and slow (25/44) responses. The others are individual subject distributions. Numbers to the left represent positive responses over the total number of trials. Red triangles indicate response times of trials for which detailed wing reconstructions were subsequently analyzed. See ‘Statistical methods’ (Materials and methods) for box plotting conventions; colors and notation as in Fig. 3. (E) Histogram of onset times for the collision-avoidance behavior in bins of 250 ms. Colors represent subjects as in D. (F) Normalized distance (see ‘Collision-avoidance behavior analysis’ in Materials and methods) from DCE center temporally aligned with the exit point. Once again, the blue and dark gray traces show the example trials from B and C, and the red traces show the mean trajectory as well as its standard deviation bounds.
Fig. 6.
Fig. 6.
Collision-avoidance behavior directions, pooled across five subjects and 53 trials (tight tether). (A) Distributions of pitch and yaw for the directions of all collision-avoidance behaviors. (Ai,v) Histograms of pitch and yaw, respectively, for all response directions (5 deg bins). (Aii,iv) Box plots of pitch and yaw, respectively, for all response directions. See ‘Statistical methods’ (Materials and methods) for box plotting conventions; colors and notation as in Fig. 5. (Aiii) Two-dimensional distribution of pitch and yaw for all response directions. Responses marked with a white and black central circle correspond to fast and slow responses, respectively. (B,C) Histograms of pitch and yaw, respectively, for slow, fast and all response directions binned into positive and negative angles. Red asterisks indicate distributions significantly different from a fair binomial distribution (see ‘Collision-avoidance behavior analysis’ in Materials and methods for details).
Fig. 7.
Fig. 7.
Correlating trajectory with forewing height. (A) Yaw trajectory from an example trial. The green trace was obtained from automatic reconstruction. The magenta trace was obtained from manual reconstruction. The magenta dashed line denotes the onset of the collision-avoidance behavior. Cyan dashed lines are the limits of the manual reconstruction window. (B) Detail of the yaw trajectory within the manual reconstruction window. Colors as in A. (C) Bold red and blue traces are wing heights contralateral and ipsilateral to the looming stimulus, respectively. For each wing, pale traces denote peak, trough and averaged wing heights. The magenta dashed line denotes the onset of the collision-avoidance behavior, as in A. Averaged stroke amplitude across both wings is 67 deg. (D) Correlation between yaw and averaged wing heights. Positive lag indicates yaw is lagging. The red trace is the contralateral wing, the blue trace is the ipsilateral wing and the black trace is the difference between the ipsilateral and contralateral wings. Vertical dashed lines indicate the time of extremal correlation and horizontal lines the corresponding correlation values. (E) Example of similar behavior in a different animal and trial in which collision-avoidance behavior was initiated at time –4.437 s.
Fig. 8.
Fig. 8.
Wing deformation and collision-avoidance behavior. (A,B) Normalized variance explained by the three principal components in cordwise and spanwise deformation spaces, respectively. Principal components analysis (PCA) was carried out over all trials and time points (10 animals, two trials per animal, >100 time points per trial, representing one yaw cycle oscillation in the locust’s body trajectory). Blue and green indicate the wings ipsilateral and contralateral to the looming stimulus, respectively. (C,D) Tangent angles associated with the first principal component for cordwise and spanwise deformation, respectively. The horizontal axis is distance along the wing, from proximal to distal, normalized to wing length. The vertical axis is the angle (relative to the reference plane) of the tangent in cordwise and spanwise directions associated with specific values of the first principal component. Principal component values are evenly sampled from maximum to minimum (11 example traces; color scale for principal component values is shown on the right). (E,F) Spatial illustration of cordwise and spanwise deformation associated with principal component value shown in the red traces of C and D, respectively. The tangent angle was converted into the associated height difference between leading and trailing edges along a typical wing. Black lines indicate the reference wing with no deformation. (G) Trajectory of ipsilateral wing deformation for a single trial illustrated in the 2D space of spanwise and cordwise first principal components. The blue trace is before and the red trace is after the onset of the collision-avoidance response. Green crossed lines indicate the point of onset of the collision-avoidance response. (H) Data as in G from the other nine trials.
Fig. 9.
Fig. 9.
Correlations between wing kinematics and body trajectory pooled across 10 trials on five subjects. (A) Correlation coefficients of yaw and contralateral (relative to the looming stimulus) wing beat-averaged height (Contralateral height), ipsilateral wing beat-averaged height (Ipsilateral height), and the difference in beat-averaged wing heights (Difference height). Colors represent separate trials, connected by matching lines. (B) Box plots of absolute values of these correlation coefficients. (C) Corresponding lag times for correlations. Positive lag means yaw comes later. (D) Partial correlation coefficients of yaw and beat-averaged first principal components of wing deformation, after factoring out the common dependence on the difference in beat-averaged wing height. From ipsilateral to contralateral, they are ipsilateral wing spanwise (Ipsilateral span), ipsilateral wing cordwise (Ipsilateral cord), contralateral wing cordwise (Contralateral cord) and contralateral wing spanwise (Contralateral span) deformations. Colors as in A. (E) Box plots of absolute values of these partial correlation coefficients. (F) Corresponding lag times for partial correlations. Positive lag means yaw comes later.

References

    1. Akaike H. (1974). A new look at the statistical model identification. IEEE Trans. Automat. Contr. 19, 716–723
    1. Baker P., Cooter R. (1979). The natural flight of the migratory locust, Locusta migratoria L. II. Gliding. J. Comp. Physiol. A Neuroethol. Sens. Neural Behav. Physiol. 131, 89–94
    1. Branson D. H. (2005). Direct and indirect effects of avian predation on grasshopper communities in northern mixed-grass prairie. Environ. Entomol. 34, 1114–1121
    1. Burrows M. (1996). The Neurobiology of an Insect Brain. Oxford, UK: Oxford University Press;
    1. Camhi J., Tom W. (1978). The escape behavior of the cockroach Periplaneta americana. J. Comp. Physiol. A Neuroethol. Sens. Neural Behav. Physiol. 128, 203–212 - PubMed

Publication types

LinkOut - more resources