. 2013 Feb 14;494(7436):201-6.
doi: 10.1038/nature11866. Epub 2013 Jan 30.

Identification of a candidate therapeutic autophagy-inducing peptide

Affiliations

Identification of a candidate therapeutic autophagy-inducing peptide

Sanae Shoji-Kawata et al. Nature. .

Abstract

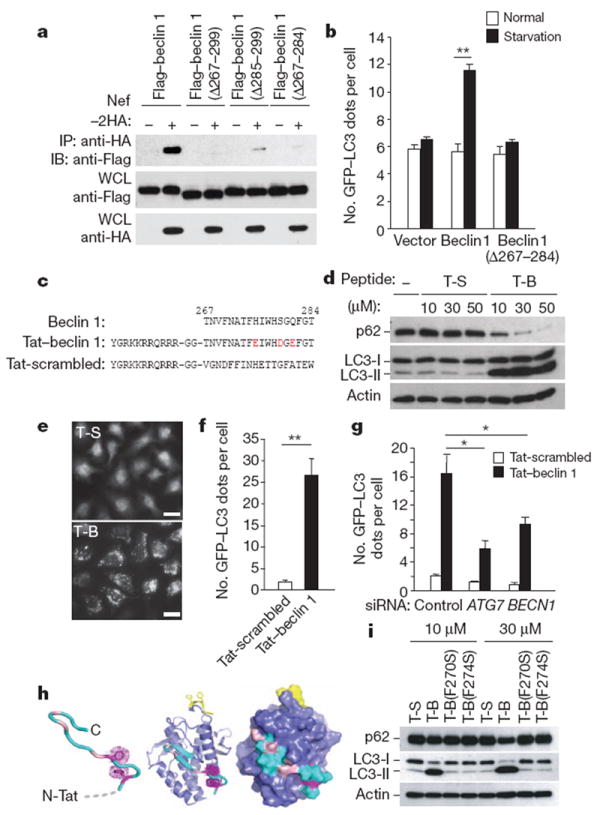
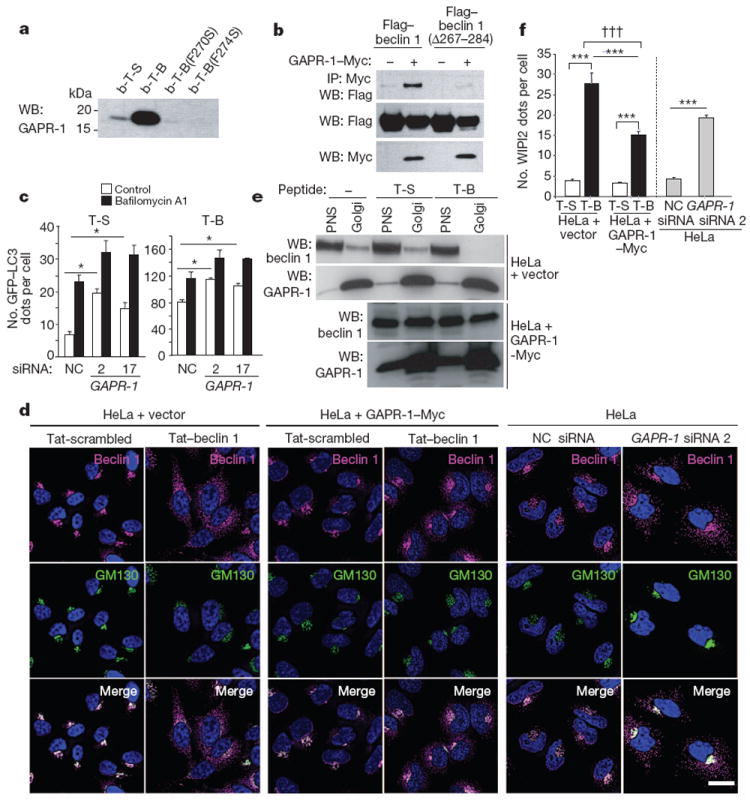
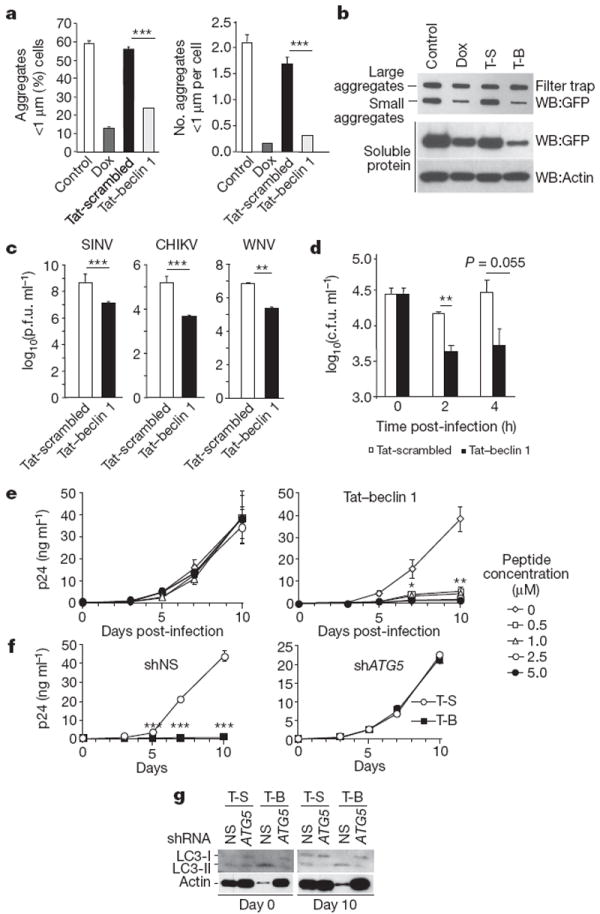
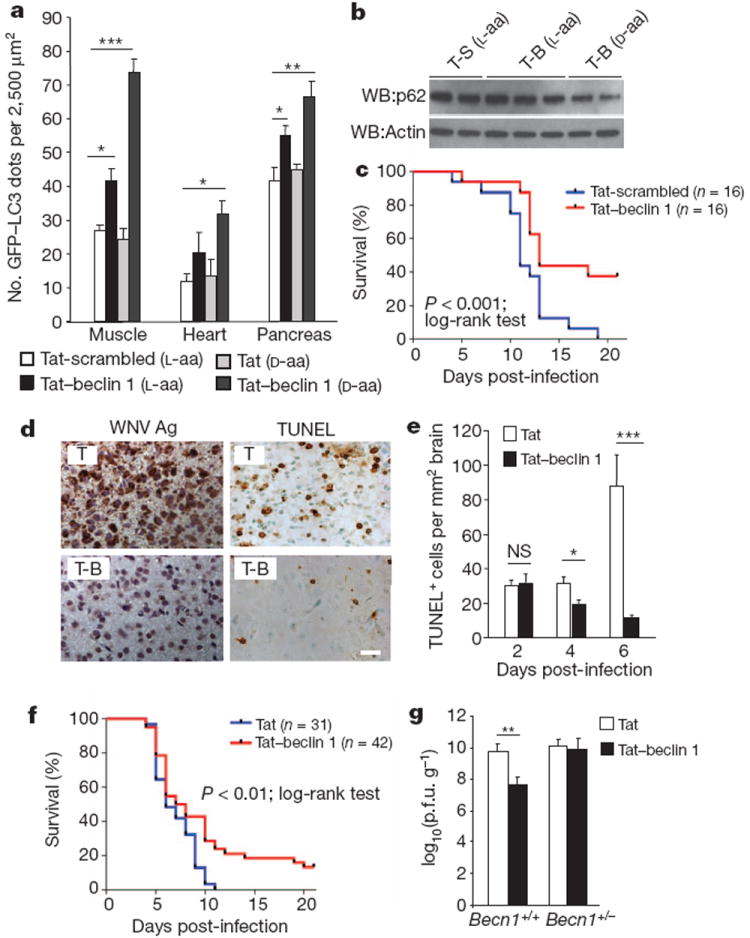
The lysosomal degradation pathway of autophagy has a crucial role in defence against infection, neurodegenerative disorders, cancer and ageing. Accordingly, agents that induce autophagy may have broad therapeutic applications. One approach to developing such agents is to exploit autophagy manipulation strategies used by microbial virulence factors. Here we show that a peptide, Tat-beclin 1-derived from a region of the autophagy protein, beclin 1, which binds human immunodeficiency virus (HIV)-1 Nef-is a potent inducer of autophagy, and interacts with a newly identified negative regulator of autophagy, GAPR-1 (also called GLIPR2). Tat-beclin 1 decreases the accumulation of polyglutamine expansion protein aggregates and the replication of several pathogens (including HIV-1) in vitro, and reduces mortality in mice infected with chikungunya or West Nile virus. Thus, through the characterization of a domain of beclin 1 that interacts with HIV-1 Nef, we have developed an autophagy-inducing peptide that has potential efficacy in the treatment of human diseases.


Conflict of interest statement

The authors declare no competing financial interests.

Figures

Figure 1
Figure 1. Tat–beclin 1 peptide induces autophagy in vitro
a, Immunoprecipitation of Flag–beclin 1 constructs with Nef–HA in HeLa cells 24 h post-transfection. b, GFP–LC3-positive dots (autophagosomes) in MCF7 cells expressing GFP–LC3 and Flag–beclin 1 constructs grown in either normal medium or starved in EBSS for 2 h. c, Sequences of beclin 1 amino acids 267–284, Tat–beclin 1 (T-B) and Tat-scrambled (T-S) control peptide. Red letters indicate amino acid substitutions to enhance hydrophilicity. d, Biochemical assessment of autophagy (p62 and LC3 immunoblots) in peptide-treated HeLa cells (3 h). e, f, Representative images (e) and quantification of GFP–LC3-positive dots (f) in peptide-treated HeLa/GFP–LC3 cells (30 μM, 3 h). Scale bars, 20 μm. g, GFP–LC3-positive dots in siRNA-transfected peptide-treated HeLa/GFP–LC3 cells (30 μM, 3 h). h, Model of Tat–beclin 1 peptide (left) based on corresponding elements of the beclin 1 evolutionarily conserved domain (ECD) structure (centre). Essential phenylalanine side chains, magenta; positions of solubility mutations, pink; lipid interaction site, yellow. ECD surface representation (right) illustrates exposure of corresponding peptide (cyan). i, p62 and LC3 immunoblots in peptide-treated HeLa cells (3 h). In b, f, g, bars represent mean ± s.e.m. of triplicate samples (50–100 cells per sample). Similar results were observed in three independent experiments. *P < 0.05, **P < 0.01; t-test.
Figure 2
Figure 2. Tat–beclin 1 peptide binds to GAPR-1, a beclin 1-interacting protein
a, HeLa cells were treated with biotin-conjugated peptides (30 μM, 3 h) and proteins bound to peptides were analysed by immunoblot with anti-GAPR-1. b-T-B, biotin–Tat–beclin 1; b-T-S, biotin–Tat-scrambled. b, Immunoprecipitation of Flag–beclin 1 with GAPR-1–Myc in HeLa cells 24 h post-transfection. c, GFP–LC3-positive dots in GAPR-1 siRNA-transfected peptide-treated HeLa/GFP–LC3 cells (20 μM, 3 h) with or without 100nM bafilomycin A1. Bars represent mean ± s.e.m. of triplicate samples (50–100 cells per sample). Similar results were observed in three independent experiments. NC, non-silencing control. d, Localization of beclin 1 and GM130 (a Golgi marker) in HeLa cells stably transduced with empty vector (left panel) or GAPR-1–Myc (middle panel) or transfected with GAPR-1 siRNA (right panel) and treated with peptide (20 μM, 1 h). Scale bar, 20 μm. e, Immunoblot of beclin 1 in post-nuclear supernatant (PNS) and Golgi-enriched fractions in HeLa cells stably transduced with empty vector or GAPR-1–Myc after peptide treatment (20 μM, 2 h). f, WIPI2 dots in cells in the experimental conditions shown in d. Bars represent mean ± s.e.m. for 100–150 cells. *P < 0.05, ***P < 0.001; t-test. †††P < 0.001; two-way ANOVA for comparison of magnitude of changes between groups.
Figure 3
Figure 3. Tat–beclin 1 peptide decreases aggregates of a polyglutamine expansion protein and has anti-infective activity
a, Percentage of cells with small htt103Q aggregates (left) and number of aggregates per cell (right) in HeLa cells expressing doxycycline (Dox)-repressible CFP–htt103Q after daily treatment with doxycycline or peptide (20 μM, 4 h per day) for 2 days. Bars represent mean ± s.e.m. of triplicate samples (60–120 cells per sample). Similar results were observed in three independent experiments. b, Filter trap assays for htt103Q large and small aggregates in HeLa/htt103Q cells. c, Viral titres in HeLa cells infected with 0.1 plaque-forming units (p.f.u.) per cell of SINV, CHIKV or WNV (strain TX02) and treated with peptide (10 μM, 4–8 h post-infection). Values represent geometric mean ± s.e.m. for triplicate samples of supernatants collected 18 h post-infection (SINV) or 24 h post-infection (CHIKV and WNV). Similar results were observed in three independent experiments. d, Bacteria colony-forming units (c.f.u.) in primary BMDMs infected with L. monocytogenes ΔactA mutant strain DPL-4029 for 30 min and treated with peptide (10 μM from 0 to 2 h post-infection). Bars represent mean ± s.e.m. of triplicate samples. Similar results were observed in three independent experiments. e, HIV-1 p24 antigen release in primary human MDMs infected with HIV-1 24 h after initiation of daily peptide treatment. Values represent mean ± s.e.m. of triplicate samples. Similar results were observed in MDMs from three independent donors. f, HIV-1 p24 antigen release in MDMs transduced with nonspecific scrambled shRNA (shNS) or ATG5 shRNA (shATG5) and treated daily with peptide (5 μM). Values represent mean ± s.e.m. of triplicate wells. Similar results were observed in MDMs from two independent donors. g, LC3 immunoblot of MDMs transduced with the indicated shRNA at day 0 and day 10 after HIV-1 infection. *P<0.05; **P < 0.01; ***P < 0.001; t-test.
Figure 4
Figure 4. Tat–beclin 1 peptide induces autophagy and exerts antiviral activity in vivo
a, GFP–LC3-positive dots in tissues of 6-week-old GFP–LC3 mice treated with the indicated peptide (20 mg kg−1 i.p., 6 h). A minimum of ten fields was counted per tissue section. Bars represent mean ± s.e.m. for three mice. Similar results were observed in three independent experiments. b, p62 immunoblot of brains of 5-day-old GFP–LC3 mice treated with the indicated peptide (20 mg kg−1 i.p., 6 h). c, Survival curves of 5-day-old C57BL/6J mice infected with CHIKV(106 p.f.u. s.c.) and treated daily with peptide (15 mg kg−1 i.p. beginning 1 day post-infection). d–f, Representative images of WNV envelope antigen and TdT-mediated dUTP nick end labelling (TUNEL) staining (d) (T, Tat alone), quantification of cell death in brain (e), and survival curves (f) for 5-day-old C57BL/6J mice infected with WNV (Egypt strain 101, 1 p.f.u. intracerebral (i.c.)) and treated daily with peptide (d-amino acid forms, 20 mg kg−1 i.p. beginning 1 day post-infection). Images in d are from cerebral cortex day 6 post-infection. Similar results were observed in all regions of the brain for three mice per group. Scale bar, 20 μm. Bars in e represent mean ± s.e.m. TUNEL-positive cells per unit area of brain for three mice. g, Geometric mean + s.e.m. viral titres of WNV-infected mouse brains day 6 post-infection. Values represent combined data for 12–20 mice per treatment group from 10 to 12 litters. Data in c and f represent combined survival probabilities for three and four independent litters, respectively, in each group. Similar results were observed in each independent experiment. *P < 0.05; **P < 0.01; ***P < 0.001; NS, not significant; t-test.

Comment in

References

    1. Levine B, Kroemer G. Autophagy in the pathogenesis of disease. Cell. 2008;132:27–42. - PMC - PubMed
    1. Mizushima N, Levine B, Cuervo AM, Klionsky DJ. Autophagy fights disease through cellular self-digestion. Nature. 2008;451:1069–1075. - PMC - PubMed
    1. Rubinsztein DC, Codogno P, Levine B. Autophagy modulation as a potential therapeutic target for diverse diseases. Nature Rev Drug Discov. 2012;11:709–730. - PMC - PubMed
    1. Kihara A, Kabeya Y, Ohsumi Y, Yoshimori T. Beclin-phosphatidylinositol 3-kinase complex functions at the trans-Golgi network. EMBO Rep. 2001;2:330–335. - PMC - PubMed
    1. Kyei GB, et al. Autophagy pathway intersects with HIV-1 biosynthesis and regulates viral yields in macrophages. J Cell Biol. 2009;186:255–268. - PMC - PubMed

Publication types

MeSH terms

Substances