

Rating disease progression of Friedreich's ataxia by the International Cooperative Ataxia Rating Scale: analysis of a 603-patient database
- PMID: 23365101
- PMCID: PMC3624678
- DOI: 10.1093/brain/aws309
Rating disease progression of Friedreich's ataxia by the International Cooperative Ataxia Rating Scale: analysis of a 603-patient database
Abstract
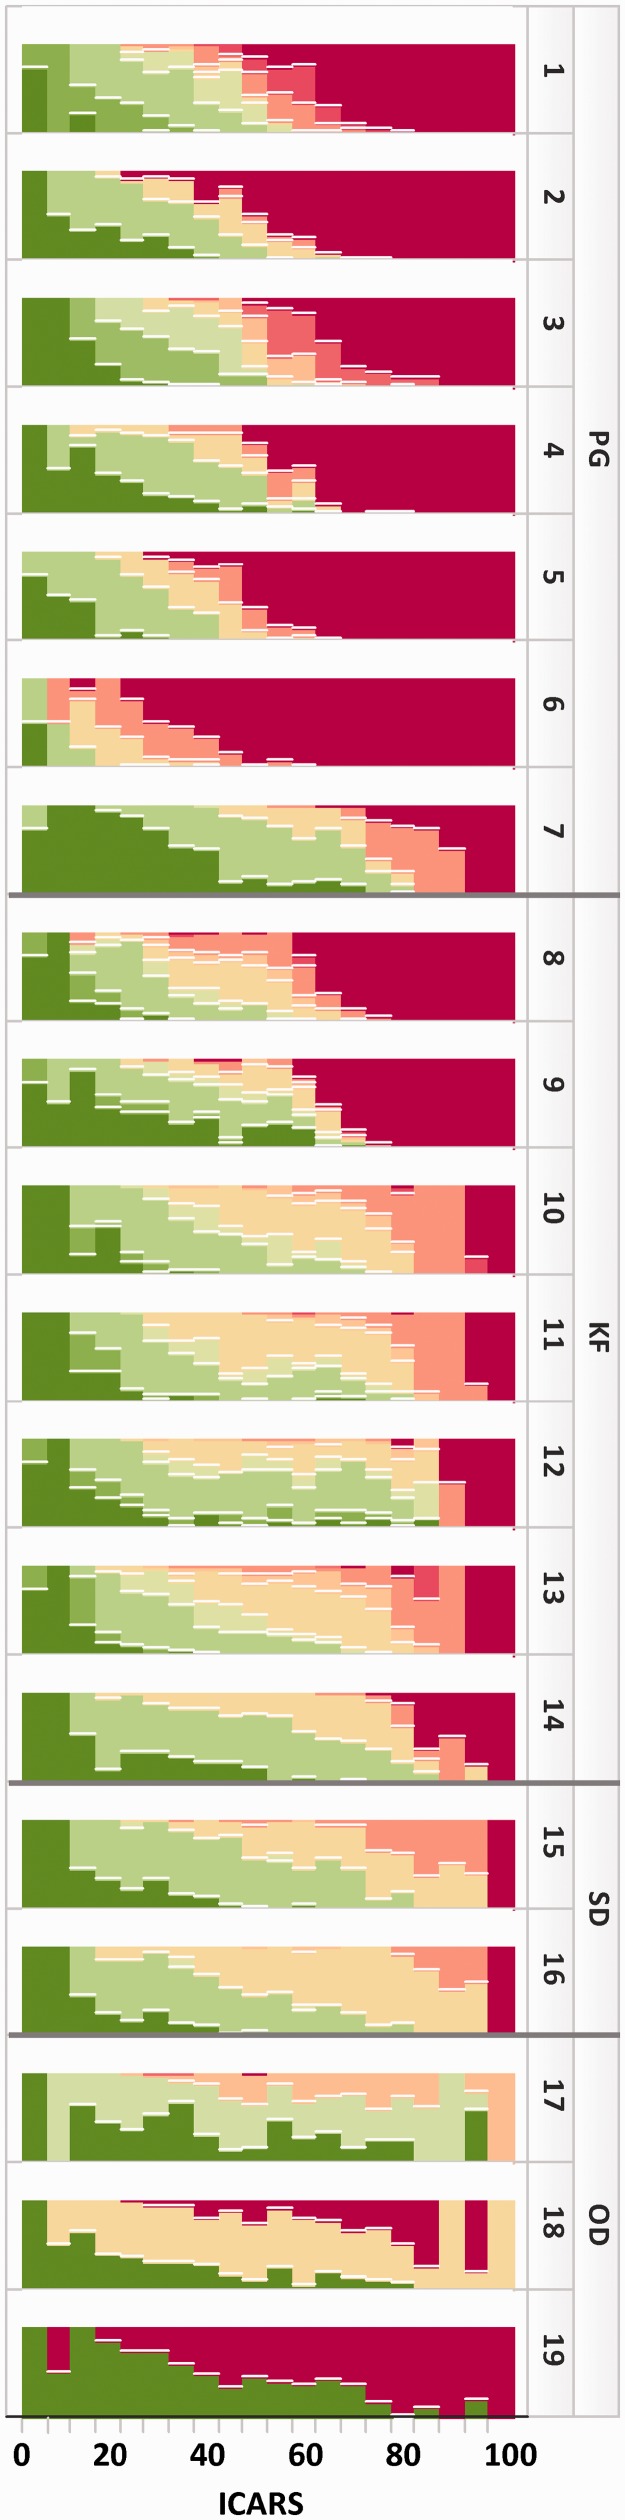
The aim of this cross-sectional study was to analyse disease progression in Friedreich's ataxia as measured by the International Cooperative Ataxia Rating Scale. Single ratings from 603 patients with Friedreich's ataxia were analysed as a function of disease duration, age of onset and GAA repeat lengths. The relative contribution of items and subscales to the total score was studied as a function of disease progression. In addition, the scaling properties were assessed using standard statistical measures. Average total scale progression per year depends on the age of disease onset, the time since diagnosis and the GAA repeat length. The age of onset inversely correlates with increased GAA repeat length. For patients with an age of onset ≤14 years associated with a longer repeat length, the average yearly rate of decline was 2.5 ± 0.18 points in the total International Cooperative Ataxia Rating Scale for the first 20 years of disease duration, whereas patients with a later onset progress more slowly (1.8 ± 0.27 points/year). Ceiling effects in posture, gait and lower limb scale items lead to a reduced sensitivity of the scale in the severely affected population with a total score of >60 points. Psychometric scaling analysis shows generally favourable properties for the total scale, but the subscale grouping could be improved. This cross-sectional study provides a detailed characterization of the International Cooperative Ataxia Rating Scale. The analysis further provides rates of change separated for patients with early and late disease onset, which is driven by the GAA repeat length. Differences in the subscale dynamics merit consideration in the design of future clinical trials applying this scale as a neurological assessment instrument in Friedreich's ataxia.
Figures


References
-
- Arnold P, Boulat O, Maire R, Kuntzer T. Expanding view of phenotype and oxidative stress in Friedreich's ataxia patients with and without idebenone. Schweiz Arch Neurol Psychiatr. 2006;157:169–76.
-
- Burk K, Malzig U, Wolf S, Heck S, Dimitriadis K, Schmitz-Hubsch T, et al. Comparison of three clinical rating scales in Friedreich ataxia (FRDA) Mov Disord. 2009;24:1779–84. - PubMed
-
- Cano SJ, Hobart JC, Hart PE, Korlipara LV, Schapira AH, Cooper JM. International Cooperative Ataxia Rating Scale (ICARS): appropriate for studies of Friedreich's ataxia? Mov Disord. 2005;20:1585–91. - PubMed
-
- Delatycki MB. Evaluating the progression of Friedreich ataxia and its treatment. J Neurol. 2009;256(Suppl 1):36–41. - PubMed
-
- Di Prospero NA, Baker A, Jeffries N, Fischbeck KH. Neurological effects of high-dose idebenone in patients with Friedreich's ataxia: a randomised, placebo-controlled trial. Lancet Neurol. 2007;6:878–86. - PubMed
Publication types
MeSH terms
LinkOut - more resources
Full Text Sources
Other Literature Sources
Medical
Miscellaneous
