. 2013 Jan 30;33(5):1759-72.
doi: 10.1523/JNEUROSCI.3334-12.2013.

Sonic Hedgehog signaling is a positive oligodendrocyte regulator during demyelination

Affiliations

Sonic Hedgehog signaling is a positive oligodendrocyte regulator during demyelination

Julien Ferent et al. J Neurosci. .

Abstract

The morphogen Sonic Hedgehog (Shh) controls the generation of oligodendrocyte (OLs) during embryonic development and regulates OL production in adulthood in the cortex and corpus callosum. The roles of Shh in CNS repair following lesions associated with demyelinating diseases are still unresolved. Here, we address this issue by using a model of focal demyelination induced by lysolecithin in the corpus callosum of adult mice. Shh transcripts and protein were not detected in control animals but were upregulated in a time-dependent manner in the oligodendroglial lineage within the lesion. We report an increased transcription of Shh target genes suggesting a broad reactivation of the Shh pathway. We show that the adenovirus-mediated transfer of Shh into the lesioned brain results in the attenuation of the lesion extent with the increase of OL progenitor cells (OPCs) and mature myelinating OL numbers due to survival, proliferation, and differentiation activities as well as the decrease of astrogliosis and macrophage infiltration. Furthermore, the blocking of Shh signaling during the lesion, using its physiological antagonist, Hedgehog interacting protein, results in a decrease of OPC proliferation and differentiation, preventing repair. Together, our findings identify Shh as a necessary factor playing a positive role during demyelination and indicate that its signaling activation stands as a potential therapeutic approach for myelin diseases.


Figures

Figure 1.
Figure 1.
LPC-induced demyelination in the plp-GFP transgenic line. A, B, Visualization of GFP (green) in frontal brain sections of vehicle- and LPC-treated animals immunostained for Ki67 (red). C, Triple immunolabeling for GFP, CC1, and Olig2 in rostral coronal brain sections of an adult mouse treated with LPC. Both the LPC-injected and the contralateral corpus callosum of the same animal are shown. The lesion site, delineated by the weak or absent GFP expression that reflects the decrease in plp expression and thus OL survival, displays CC1+/Olig2+ mature OLs and CC1/Olig2+ OPC, which express low levels of GFP compared with the high levels detected within the same cell populations in the contralateral corpus callosum. cc, Corpus callosum; Cx, cerebral cortex. Scale bars: A, B, 200 μm; C, 100 μm.
Figure 2.
Figure 2.
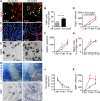
Shh is expressed in the OL lineage during demyelination of adult brain. A, Endogenous GFP fluorescence (green) analyzed by confocal microscopy in frontal brain sections from plp-GFP mice treated 4 d earlier with vehicle or LPC. B, Fluorescent ISH experiment performed on adjacent sections (at a level corresponding to the area boxed in yellow in A). Shh+ signals (red) are detected in the demyelinated corpus callosum of the LPC-treated animal, but not in the control. Magnification of the area boxed in white is shown. C, At 4 dpl, Shh transcripts are detected within the lesion in cells coexpressing Olig2 (white arrowhead). D, Immunofluorescent labeling of Shh protein (red) at 4 dpl in vehicle-treated and 4 dpl, 7 dpl, or 10 dpl in LPC-treated animals. E, Number of Shh+ cells in the above conditions compared with levels observed in the vehicle-treated mice. F, At 7 dpl, Shh immunolabeling (red) is colocalized with the endogenous GFP fluorescence (green) associated with cells in the lesion, delineated by the white dotted line. G, A population of Shh+ cells also coexpresses PDGFRα (green) in the lesion. The dotted-line box shows one Shh+ cell, which does not express PDGFRα, whereas the yellow box highlights two cells expressing both Shh and PDGFRα. H, Quantification of the percentage of Shh+ cells coexpressing PDGFRα, the plp-GFP reporter. Values are the mean ± SEM of three to four animals in each group. cc, Corpus callosum; Cx, cerebral cortex; CPu, caudate-putamen. Scale bars: A, F, 100 μm; B, D, 50 μm; C, 20 μm.
Figure 3.
Figure 3.
Upregulation of the Shh signaling pathway in the model of focal demyelination. A, Right, GFP fluorescence in the region of the corpus callosum where LPC or the vehicle was injected as indicated on the brain scheme (10 dpl). B, ISH signals in the callosal region shown in A were obtained using the indicated antisense (AS) or sense (S) riboprobes. The lesion extent is highlighted by the white dotted line. C, Low magnification of a coronal brain section derived from an LPC-treated mouse and hybridized using the Smo AS riboprobe (right). The extent of the lesion (white line) indicated by the absence of GFP fluorescence (left) overlaps the Smo ISH signal (black line) and was measured to quantify the levels of transcript upregulation. D, Histogram showing the number of cells in the lesion that express Gli1, Gli2, Ptc, and Smo transcripts in vehicle-treated (gray bars) or LPC-treated (black bars) animals. The values are expressed per square millimeter of lesion and are the mean ± SEM of four to five animals (3–6 slices per animal). cc, Corpus callosum; Cx, cerebral cortex; St, striatum. Scale bars: A, B, 50 μm; C, 200 μm (*p < 0.05; **p < 0.001).
Figure 4.
Figure 4.
Identification of the phenotype of Shh-responding cells over the length of remyelination. A, B, Gli1 transcripts are expressed in a subset of Olig2-positive cells within LPC-induced lesion. C, Quantification of the percentage of Gli1-positive cells, which express Olig2 and GFAP in the demyelinated area by 5, 10, and 15 dpl. D–F, Expression of Smo transcripts in subsets of Olig2, GFAP, and IB4-positive cells within remyelinating areas at the indicated time points after the LPC-induced lesion. G, Quantification of the percentage of Smo-positive cells, which express Olig2, GFAP, and IB4 in the lesion by 5, 10, and 15 dpl. White plain arrowheads show double-positive cells, whereas white empty arrowheads show single immunopositive cells. The values are the mean ± SEM of three to four animals in each group. Scale bars: 50 μm.
Figure 5.
Figure 5.
Identification of infected cells in the lesioned brain of mouse injected by Ad-Control or Ad-huShh adenoviruses. A, Scheme of the regenerative protocol. B, C, Immunostaining of GFP (green) expressed by the viral constructs is detected in the wall of the LV of Ad-Control or Ad-huShh-injected brains (B) but not in the LPC-induced lesion in the corpus callosum (cc) at 10 dpl (C). Shh immunostaining (red) is associated mostly with the ependymal cell layer in the Ad-huShh condition and is evidenced in the lesions in both conditions, reflecting endogenous and exogenous Shh. Nuclei are stained with DAPI (blue). The white dotted line indicates the ventricular wall. Scale bars: B, C, 30 μm.
Figure 6.
Figure 6.
Adenovirus-mediated transfer of Shh in vivo markedly attenuates LPC-induced myelin loss by accelerating OPC differentiation into premyelinating OLs. A, B, Ad-huShh increases the proliferating Olig2+ cells at 5 dpl as indicated by the quantification of Ki67/Olig2+ in both animal groups. C–G, A significant increase in the number of Olig2+ and DM20+ OLs as well as in the fraction of DM20+ cells within the whole Olig2+ OL population is seen at 10 dpl in callosal regions compared with control-treated controls. H–K, LFB staining (H) and MBP expression (I) are shown in the demyelinated corpus callosum at 10 dpl in Ad-huShh and Ad-control mice. Smaller lesion areas and higher MBP expression are observed in Ad-huShh versus control animals. J, K, Quantifications of demyelinated areas and MBP+ cell density in Ad-huShh and Ad-control mice at 5, 10, and 15 dpl. Values are the mean ± SEM of four animals in each group. cc, Corpus callosum; Cx, cerebral cortex; CPu, caudate-putamen. Scale bars: A, C, E, I, 50 μm; H, 200 μm. *p < 0.05; **p < 0.001; ***p < 0.005.
Figure 7.
Figure 7.
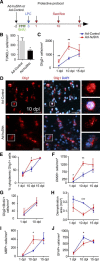
Protective effects of Ad-huShh during demyelination in OF1 mice. A, Scheme of the protective protocol. B, Transfer of Ad-huShh into the LV, 2 d before LPC injection in the corpus callosum is accompanied by a lower density of apoptotic cells identified by the TUNEL assay at 1 dpl compared with Ad-Control. C, Significant increase in the appearance of Olig2-expressing OLs at 1 and 10 dpl is detected in callosal regions from Ad-huShh compared with Ad-Control animals. D, Olig1 immunohistofluorescence detected in the LPC-induced lesion of Ad-control and Ad-huShh-treated mice. Small panels beside each picture are magnifications of a cell expressing Olig1 in the nucleus (top) and in the cytoplasm (bottom), respectively. E, The percentage of cells expressing Olig1 in the cytoplasm is higher at 10 dpl in Ad-huShh compared with Ad-Control mice. F, Significant increase in the appearance DM20-expressing OLs at 1 and 10 dpl is detected in callosal regions from Ad-huShh compared with Ad-Control animals. G, The density of SVZ-derived BrdU+/Olig2+ cells is not different in Ad-huShh compared with Ad-Control mice. H, I, An increase in myelinating OLs and a decrease in the lesion extent are also observed. J, The density of GFAP+ astrocytes is decreased in the lesion at 10 dpl. Values are the mean ± SEM of four animals in each group (*p < 0.05; **p < 0.001; ***p < 0.005). Scale bars: 100 μm.
Figure 8.
Figure 8.
Shh treatment reduces inflammation and reactive astrocytosis during remyelination of the corpus callosum. A, B, GFAP-expressing astrocytes and quantification of their density in LPC-induced lesions of animals that have received Ad-control or Ad-huShh vectors at 2 dpl (see regenerative protocol in Fig. 5A). A significant decrease is detected at 10 dpl in animals overexpressing Shh. C, D, IB4 immunofluorescence (green) detected at 5 dpl in animals receiving Ad-huShh or the control vectors at 2 dpl. Magnification of an IB4+ cell is shown in the inset. The quantification of IB4 signal indicates a significant decrease of the density of IB4+ cells at 5 dpl in the presence of Ad-huShh compared with the control vector, while no difference is observed at later time points. Values are the mean ± SEM (n = 4 in each group). DAPI labels the cell nuclei. Scale bars: 50 μm. **p < 0.001; ***p < 0.005.
Figure 9.
Figure 9.
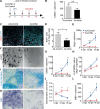
Overexpression of Hip, the physiological antagonist of Shh, in LPC-treated animals blocks OPC proliferation and differentiation preventing tissue repair. A, Scheme of the loss-of-function protocol. B, Transfer of Ad-mHip into the LV, 2 d before LPC injection in the corpus callosum does not modify the density of apoptotic cells identified by the TUNEL assay at 5 dpl compared with Ad-Control. C–E, Ad-mHip decreases the Olig2+ cells as shown on the pictures of the lesion area at 15 dpl (C) and by the quantification of Olig2+ cells compared with Ad-Control (E). It also decreases proliferating Olig2+ cells at 5 dpl as indicated by the quantification of Ki67/Olig2+ in both animal groups (D). F–H, A significant decrease in the number of DM20+ OLs (10 and 15 dpl, G) illustrated by the picture of the lesion at 15 dpl (F), as well as in the fraction of DM20+ cells within the whole Olig2+ OL population (15 dpl, H) is observed in callosal regions of Ad-mHip compared with Ad-Control animals. I–L, LFB staining (I) and MBP expression (K) are shown in the demyelinated corpus callosum at 15 dpl in Ad-mHip and Ad-control mice. Larger lesion areas and lower MBP expression are observed in Ad-mHip versus control animals. J, L, Quantifications of demyelinated areas and MBP+ cell density in Ad-mHip and Ad-Control mice at 5, 10, and 15 dpl. Values are the mean ± SEM of five animals in each group. cc, Corpus callosum; Cx, cerebral cortex. Scale bars: I, 200 μm; C, F, K, 50 μm. *p < 0.05; **p < 0.01; ***p < 0.001.

References

    1. Akazawa C, Tsuzuki H, Nakamura Y, Sasaki Y, Ohsaki K, Nakamura S, Arakawa Y, Kohsaka S. The upregulated expression of sonic hedgehog in motor neurons after rat facial nerve axotomy. J Neurosci. 2004;24:7923–7930. - PMC - PubMed
    1. Alvarez JI, Dodelet-Devillers A, Kebir H, Ifergan I, Fabre PJ, Terouz S, Sabbagh M, Wosik K, Bourbonnière L, Bernard M, van Horssen J, de Vries HE, Charron F, Prat A. The Hedgehog pathway promotes blood-brain barrier integrity and CNS immune quiescence. Science. 2011;334:1727–1731. - PubMed
    1. Amankulor NM, Hambardzumyan D, Pyonteck SM, Becher OJ, Joyce JA, Holland EC. Sonic hedgehog pathway activation is induced by acute brain injury and regulated by injury-related inflammation. J Neurosci. 2009;29:10299–10308. - PMC - PubMed
    1. Angot E, Loulier K, Nguyen-Ba-Charvet KT, Gadeau AP, Ruat M, Traiffort E. Chemoattractive activity of sonic hedgehog in the adult subventricular zone modulates the number of neural precursors reaching the olfactory bulb. Stem Cells. 2008;26:2311–2320. - PubMed
    1. Arnett HA, Fancy SP, Alberta JA, Zhao C, Plant SR, Kaing S, Raine CS, Rowitch DH, Franklin RJ, Stiles CD. bHLH transcription factor Olig1 is required to repair demyelinated lesions in the CNS. Science. 2004;306:2111–2115. - PubMed

Publication types

Substances