. 2013 Jan 30;33(5):1773-89.
doi: 10.1523/JNEUROSCI.3825-12.2013.

Top-down modulation of lateral interactions in visual cortex

Affiliations

Top-down modulation of lateral interactions in visual cortex

Nirmala Ramalingam et al. J Neurosci. .

Abstract

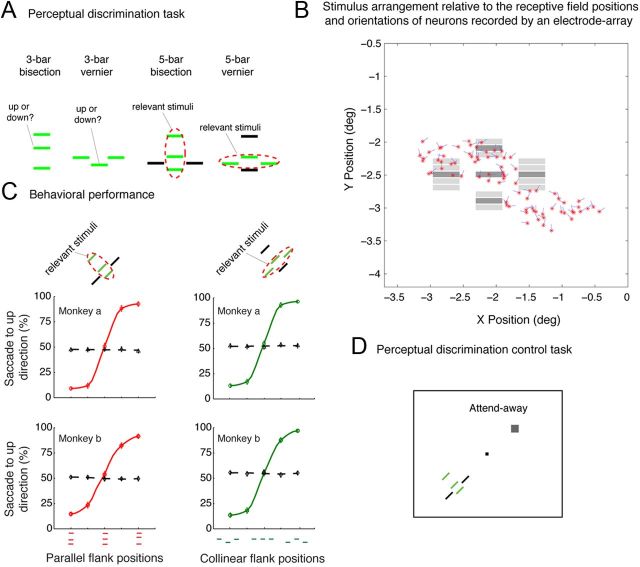
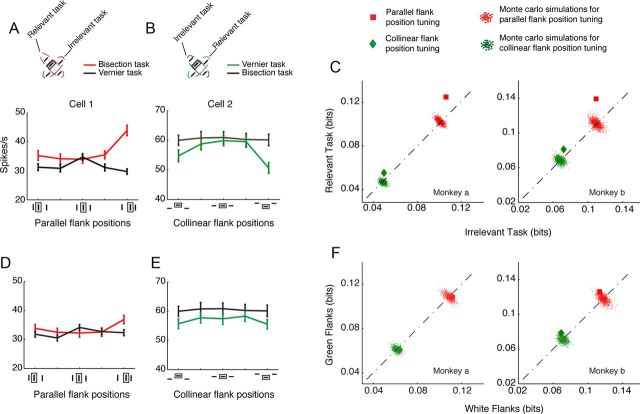
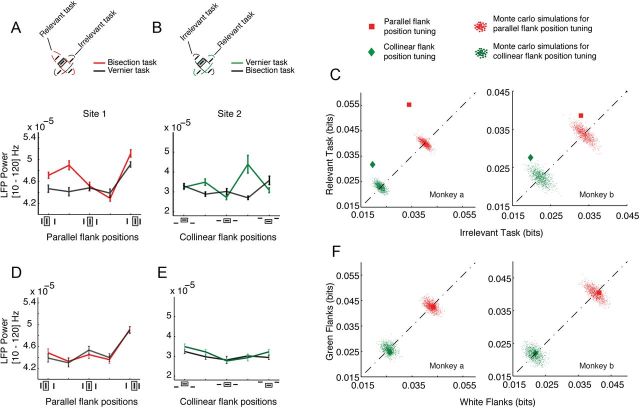
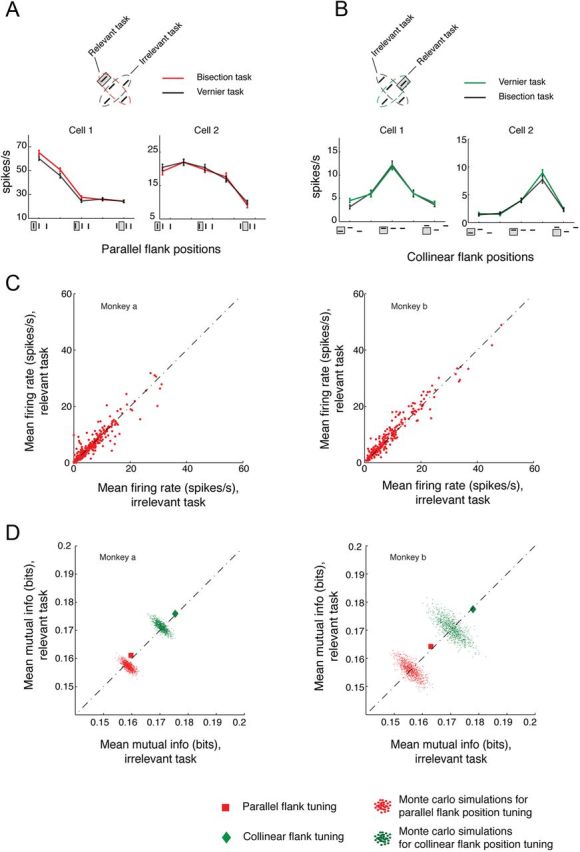
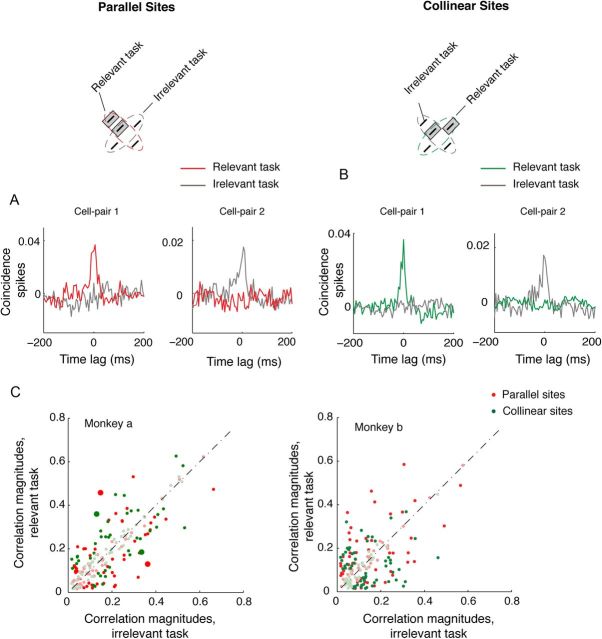
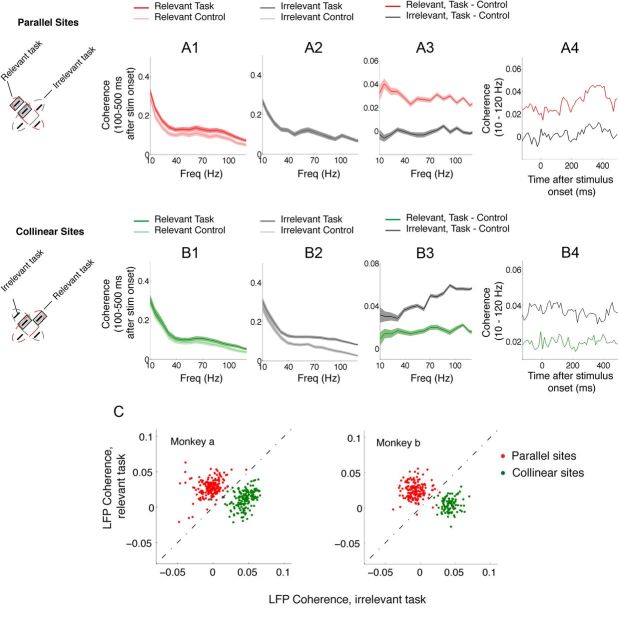
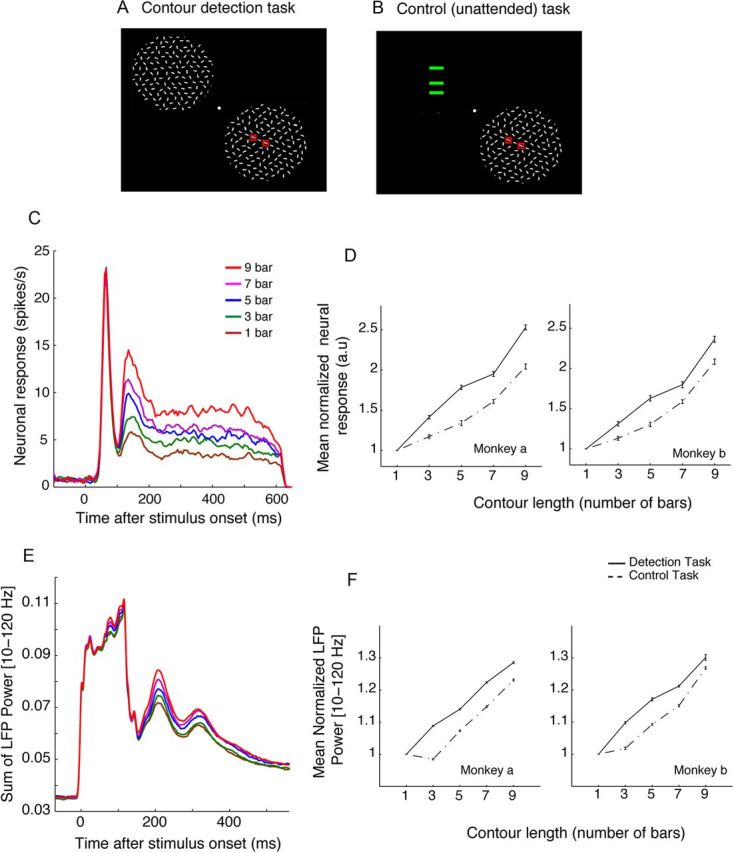
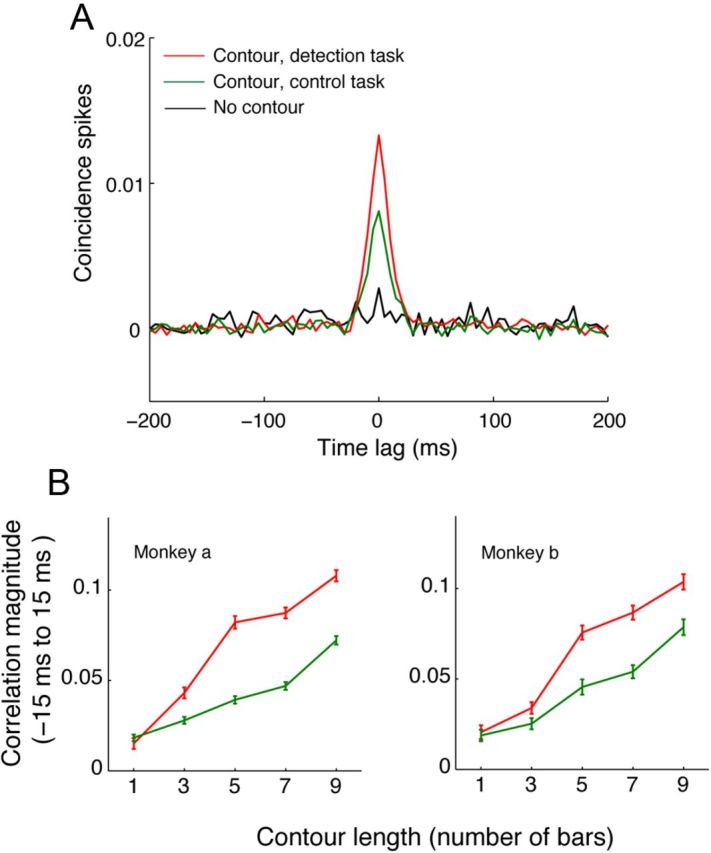
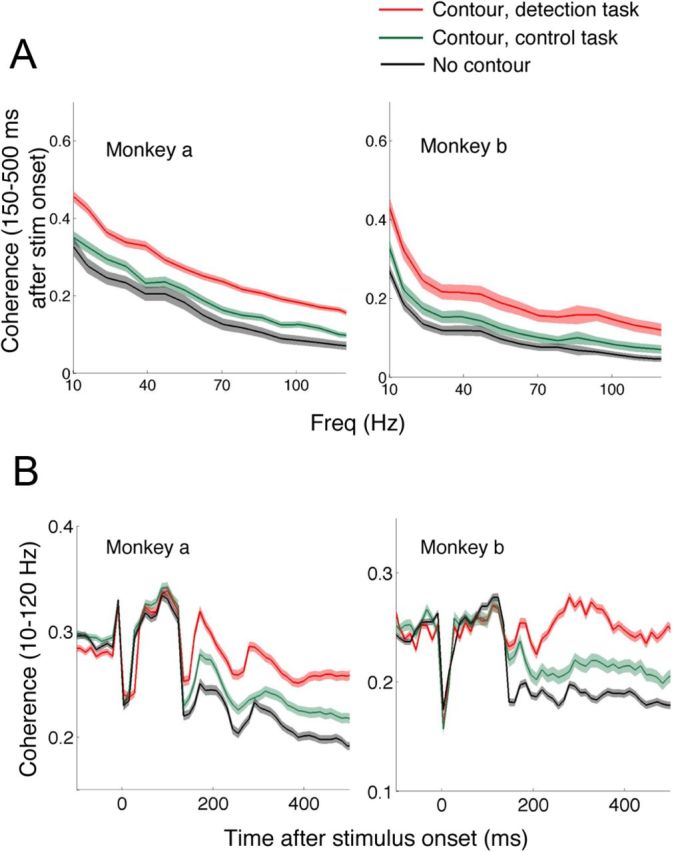
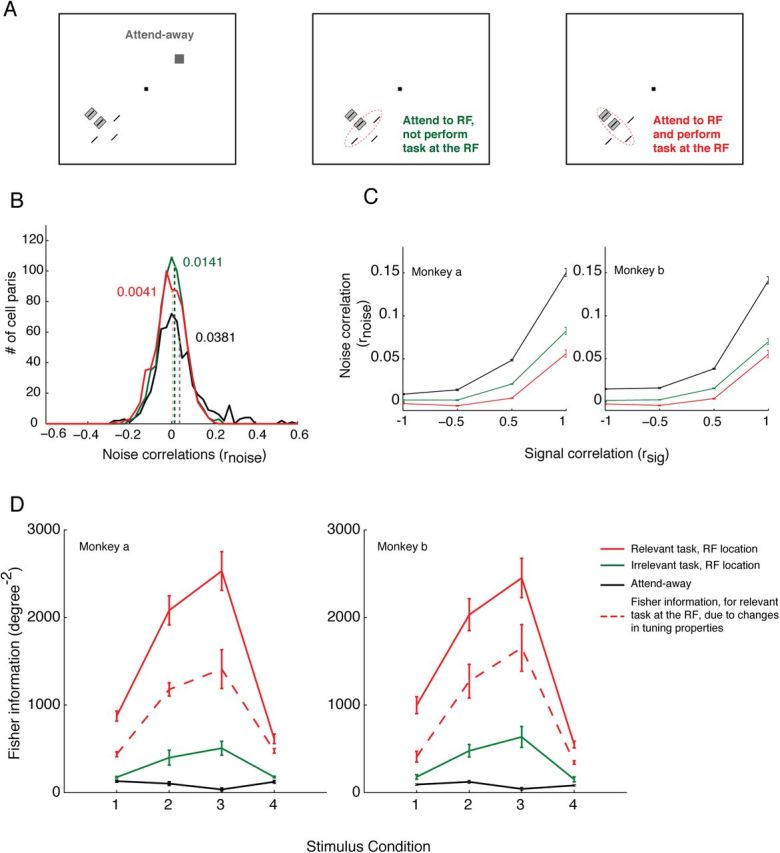
The primary visual cortex (V1) changes its computation according to the perceptual task being performed. We propose that this cognitive modulation results from gating of V1 intrinsic connections. To test this idea, using behavioral paradigms that engage top-down modulation of V1 contextual interactions, we recorded from chronically implanted electrode arrays in macaques. We observed task-dependent changes in interactions between V1 sites measured both by correlation between spike trains and by coherence between local field potentials (LFP-LFP coherence). The direction of the changes in aggregate activity, as measured by LFPs, depended on perceptual strategy: perceptual grouping increased LFP coherence between sites crucial for the task, whereas perceptual segregation lowered the LFP coherence. Using spiking activity as a measure, we found that the behaviorally driven changes in correlation structure between neurons dramatically increased the stimulus-related information that they convey; this additional increase in encoded information at the level of neuronal ensembles equals that obtained from task-driven reconfigurations of neural tuning curves. The improvements in information encoding were strongest for stimuli with greatest discrimination difficulty.


Figures

Figure 1.
Figure 1.
Five bar perceptual discrimination task. A, Stimulus design for 5 bar perceptual discrimination tasks. The bisection task required the animal to judge whether the center bar was closer to the bottom or top parallel flank. In the vernier task, the animal had to judge whether the center bar was above or below the collinear flanks. When performing these tasks with the 5 bar stimulus, the animal was cued to the task to be performed by color: green indicated which bars had to be used for discrimination. B, RF centers of the neurons near the electrodes in the array implanted in one monkey and the stimulus arrangement in one sample recording session. Red stars indicate the RF centers; and the oriented line segments at each red star indicate the orientation preference of the neurons. The gray bars represent the size and position of the 5 bars used in the stimulus. C, Population psychometric functions, for the two monkeys, observed during the bisection (red) and vernier (green) tasks, with the 5 bar stimuli. The black dashed curves were obtained by assuming that the animals' responses were based on the task-irrelevant stimuli bars. N = 55 and N = 25 for Monkey a and b, respectively. Error bars indicate SEM. D, Control task used to measure changes purely resulting from a change in color of stimulus flanks. During this task, the animals performed a visual task on the hemifield opposite to that of the recorded RFs, whereas the 5 bar stimulus was presented over the recorded RFs.
Figure 2.
Figure 2.
Task-dependent modulations of contextual interactions in V1 spiking activity. A, Responses of a sample V1 cell for various positions of parallel flanks under the relevant (red line) and irrelevant task conditions (black line). Higher modulation in the cell's response was observed when the animal performed a task involving parallel bars (relevant task, bisection task; mutual information, 0.1303) compared with when the animal performed a task involving collinear bars (irrelevant task, vernier task; mutual information, 0.0771). B, Responses of another sample V1 cell for various collinear flank positions under the two task conditions (green line, relevant, vernier task; black line, irrelevant, bisection task). The cell showed higher modulation for the relevant task condition (mutual information: vernier, relevant task, 0.0836; bisection, irrelevant task, 0.0072). C, Population-averaged mutual information (bits) for the parallel (red square) and collinear (green diamond) flank position tuning under the two task conditions (N = 57 and N = 30 for Monkey a and Monkey b, respectively). The red and green clouds represent the population means of mutual information for 1000 Monte Carlo simulations of the spike data (see Materials and Methods for details). D, Responses of the same neuron in A for various positions of parallel flanks when the flanks were green (bisection stimulus; red line) and white (vernier stimulus; black line) during the control task. The cell showed no task-dependent modulations in its tuning during the control task (mutual information: green flanks, 0.0671; white flanks, 0.0659). E, Responses of the cell shown in B for various positions of collinear flanks when the flanks were green (vernier stimulus; red line) and white (bisection stimulus; black line) during the control task. No task-dependent modulation was observed for this cell during the control task (mutual information: green flanks, 0.0072; white flanks, 0.0093). F, Similar to C, except that the animal was performing a visual task in the hemifield opposite to that of the recording visual field. A, B, D, E, Error bars indicate SEM.
Figure 3.
Figure 3.
Task-driven changes of contextual interactions in V1 LFP power. A, LFP power tuning (10–120 Hz; 100–500 ms after stimulus onset) of a sample V1 site for various positions of parallel flanks under the relevant (red line) and irrelevant (black line) task conditions. LFP power was highly modulated and informative when the animal performed a task involving parallel bars (relevant task: bisection; mutual information, 0.0870) compared with when the animal performed a task involving collinear bars (irrelevant task: vernier; mutual information, 0.0563). B, Another sample V1 site's LFP power tuning for various collinear flank positions under the two task conditions (green line, relevant, vernier task; black line, irrelevant, bisection task). LFP power at this site showed higher modulation for the relevant task condition (mutual information: relevant task, 0.2352; irrelevant task, 0.0798). C, Population-averaged mutual information for the parallel (red square) and collinear (green diamond) flank position tuning under the two task conditions (N = 50 and N = 30 for Monkey a and Monkey b, respectively). The red and green clouds represent the population means of mutual information for 1000 Monte Carlo simulations of the LFP data (see Materials and Methods for details). D, LFP power tuning for the same site in A for various positions of parallel flanks when the flanks were green (bisection stimulus; red line) and white (vernier stimulus; black line) during the control task. The sites showed no task-dependent modulations in LFP power tuning during the control task (mutual information: green flanks 0.0632, white flanks 0.0649). E, LFP power tuning for the same site in B for various positions of collinear flanks when the flanks were green (vernier stimulus; red line) and white (bisection stimulus; black line) during the control task. No task-dependent modulation in LFP power tuning was observed for this site during the control task (mutual information: green flanks 0.0753, white flanks 0.0748). F, Similar to C, except that the animal was performing a visual task in the hemifield opposite to that of the recording visual field. A, B, D, and E, Error bars indicate SEM.
Figure 4.
Figure 4.
Flank channel responses. A, Spiking responses of two sample neurons, with receptive fields over one of the parallel flanks, under the bisection (red line) and vernier task (black line). For various positions of parallel flanks within their RFs, these cells showed no difference in their responses for the two task conditions. B, Two sample collinear flank channel responses under the vernier (green line) and bisection task (black line), showing no task-driven changes in their responses for different collinear flank positions. C, Population plot for mean firing rate of the flank channels (both parallel and collinear flanks) under the relevant and irrelevant task conditions, demonstrating no significant changes in their firing rate (N = 497 and 232 for Monkey a and Monkey b, respectively; p = 0.6448 and 0.3238 for the difference in the firing rates for Monkey a and Monkey b, respectively, Wilcoxon signed-rank test). D, Population plot for mean mutual information encoded by the flanking sites (red indicates parallel flanks; and green, collinear flanks) under the relevant and irrelevant task conditions. These sites showed no significant task-dependent changes in the encoded mutual information. A, B, Error bars indicate SEM.
Figure 5.
Figure 5.
Top-down modulations of spiking correlations. Spiking correlations between V1 neurons showed task-dependent changes. A, Normalized cross-correlograms of two sample V1 cell pairs with parallel RFs under different task conditions. Red curves indicate the correlations when the animal performed the bisection task, where the flank positions were task-relevant; and the gray curves show correlations when the animal performed the vernier task, where they were irrelevant to the task. One cell pair (left) had higher correlations during the relevant task and the other (right) had higher correlations during the irrelevant task. B, Same as A, except for two sample collinear V1 sites. Here the relevant task was the vernier task (green curves) and the irrelevant task was the bisection task (gray curves). Again, one cell pair showed stronger correlations for the relevant task while the other for the irrelevant task. C, Population distribution of correlation magnitudes for the parallel (red points) and collinear (green points) cell pairs, under the relevant and irrelevant tasks. Only cell pairs that showed significant correlations in at least one task are shown here (86 and 79 parallel, collinear cell pairs in Monkey a; 84 and 83 parallel, collinear cell pairs in Monkey b). The darker points represent cell pairs that had significantly different correlations under the two tasks; and the lighter points, the cell pairs with no significant task-dependent changes in correlations (see Materials and Methods for details about the statistical test). Approximately half of the cell pairs with significant correlations showed task dependency. The bigger red and green circles indicate the correlation magnitudes of the sample cell pairs shown in A and B, respectively.
Figure 6.
Figure 6.
Top-down influences on LFP coherence in V1. A1–A3, Population-averaged coherence of parallel V1 sites (as shown in the diagram on the left) under different task conditions (N = 382). A1, Shift-corrected LFP-LFP coherence from 100–500 ms after stimulus onset, as a function of frequency. Dark red curve indicates the coherence during the relevant, bisection task involving parallel bars; and lighter red curve indicates the coherence between the same sites during a control task, when the animal performed a perceptual task on the opposite hemifield when the same 5 bar stimulus was presented over the recording location. A2, LFP coherence during the irrelevant, vernier task (dark gray) and the corresponding control stimuli (lighter gray). A3, Perception-related LFP coherence between parallel sites for the relevant (red) and irrelevant (black) task conditions. These curves were calculated as the difference between the curves in A1 and A2. These sites increased their coherence when the animal performed the task that was relevant to the sites. B1–B3, Population coherence plots of collinear V1 sites (as shown in the diagram on the left) under different task conditions (N = 296). B1, Dark green curve indicates the LFP coherence during the relevant vernier task; and lighter green curve indicates the coherence during the control task. B2, LFP coherence during the irrelevant, vernier task (dark gray) and the corresponding control stimuli (lighter gray). A3, Perception-related LFP coherence between collinear sites for the relevant (green) and irrelevant (black) task conditions. Note that these sites reduced their coherence during the relevant task (B3). A4, B4, Time course of task-dependent modulations in LFP coherence between the parallel and collinear sites, respectively. Here mean coherence in 10–120 Hz is plotted as a function of time after stimulus presentation; LFP coherence was estimated using a 120-ms-wide sliding window. The values on the x-axis indicate the center time point of the moving window (e.g., 0 marks the time window starting at 60 ms before stimulus onset and ending at 60 ms after stimulus onset). Task-driven differences in LFP coherence, for both parallel and collinear sites, were present for the entire trial period and emerged before stimulus presentation. C, Distribution of coherence magnitudes (in 10–120 Hz, 100–500 ms after stimulus onset) for the population of parallel (red) and collinear (green) V1 sites during the two discrimination tasks. N = 224 parallel and 187 collinear sites for Monkey a; 158 parallel and 109 collinear sites for Monkey b. A1–A4, B1–B4, Shaded areas represent SEM.
Figure 7.
Figure 7.
V1 contour integrative properties. A, Contour detection task. The animal was trained to detect the presence of a contour in one of the two patches of randomly positioned and oriented lines. B, Control task where the animal performed a perceptual task in the hemifield opposite to the visual field location of the RFs of the recorded neurons. During the control task, the contour stimulus embedded in the complex background was presented in the RF of the recorded neurons. C, Population-averaged spiking response profiles of V1 neurons for contours of varying lengths during the contour detection task (N = 67). Longer, salient contours resulted in sustained higher spiking responses, starting ∼100 ms after stimulus onset. D, Population-averaged spiking activity in V1 neurons, for various contours, during the contour detection (solid curve) and unattended (broken curve) tasks. The mean neural response for each contour length, within a task condition, was normalized by the response to the 1 bar stimulus. The contour-related facilitation in neural responses was higher when the animal was actively looking for the contour (i.e., during the contour detection task; N = 44 and N = 23 for Monkey a and Monkey b, respectively). E, Mean population V1 LFP power in the 10–120 Hz range for contours of varying length during the contour detection task. The LFP power was estimated using a 120-ms-wide sliding window. The values on the x-axis indicate the center time point of the moving window (e.g., 0 marks the time window starting at 60 ms before stimulus onset and ending at 60 ms after stimulus onset, so that the power begins to rise when the forward end of the window reaches 50 ms after stimulus onset). LFP power increased with contour length, with a similar delay as that seen in spiking activity. F, Normalized and averaged LFP power in V1 as a function of contour length for the detection and unattended tasks (solid and broken curves, respectively). The mean neural response for a contour length was normalized by the response to the 1 bar stimulus. Error bars indicate SEM.
Figure 8.
Figure 8.
Task-dependent modulation of contour-related V1 spiking interactions. A, Population spiking cross-correlations (normalized) between collinear V1 sites in the absence of a contour, in the presence of a contour during contour detection task, and in the presence of a contour during the attend-away task (black, red, and green curves, respectively; N = 265 and 89 for Monkey a and Monkey b, respectively). The red and green curves were obtained by pooling observed correlations for 3, 5, 7, and 9 bar contour conditions (see Materials and Methods). B, Correlation magnitudes between the collinear V1 sites as a function of contour length and task conditions. The red curve gives the magnitude of correlations for different contour lengths when the animal performed the contour detection task, whereas the green curve gives the same information for the attend-away task. Error bars indicate SEM.
Figure 9.
Figure 9.
Task-driven changes in LFP coherence between V1 contour sites. A, LFP-LFP coherence over the population of collinear sites (N = 350 for Monkey a and 102 for Monkey b) as a function of frequency for no contour (black), contour during detection task (red), and contour during attend-away task (green). Shift-corrected, mean LFP coherence from 150 to 500 ms after the stimulus onset is shown. B, Time course of mean population LFP coherence for different stimulus and task conditions (black indicates no contour; red, contour during detection task; and green, contour during control task). LFP coherence was estimated using a 120-ms-wide sliding window. The values on the x-axis indicate the center time point of the moving window (e.g., 0 marks the time-window starting at 60 ms before stimulus onset and ending at 60 ms after stimulus onset). Shaded areas represent SEM.
Figure 10.
Figure 10.
Top-down modulation of V1 neuronal variability. A, Depiction of the different task conditions used in the study. Left panel, attend-away condition, when the animal performed a task in the hemifield opposite to the RF of the recorded neurons. Middle panel, When the animal attended to the recorded locations, but performed a task not involving the stimuli encoded by the cell pair. Right panel, When the animal attended and performed a perceptual task at the recorded locations involving the stimuli encoded by the cell pair. B, Comparison of noise correlations in V1 for the three task conditions given in A. Black indicates attend-away; green, attention at the recorded locations; and red, attention and task at the recorded locations. The mean of each distribution is given by the numbers near the curves and the colored dotted lines. Noise correlations reduced considerably when the animal performed a task compared with just shift in attention. C, Comparison of relationship between signal and noise correlations in the three task conditions; same conventions as before. Similarly tuned neurons (neurons with positive signal correlations) showed the largest task-driven reduction in noise correlations. N = 304 and 298 for Monkey a and Monkey b, respectively. D, Fisher information for the recorded V1 population under the three task conditions (black, attend-away; green, attention at the recorded locations; and red, task at the recorded locations), as a function of change in stimulus bar positions (The numbers 1–5 represent the 5 different position of flanks: 1 being the extreme up position and 5 the extreme down position). V1 network carried substantially more information about the stimulus when the animal performed a task at the recorded locations (red curve), and the network was most informative for stimuli with greatest discrimination difficulty (conditions 2 and 3). The dotted red curve provides a measure of task-dependent increase in information, when the animal performed a perceptual task at the recorded location resulting from changes in neuronal tuning properties (see Materials and Methods). Error bars indicate SEM.

Similar articles

Cited by

References

    1. Abbott LF, Dayan P. The effect of correlated variability on the accuracy of a population code. Neural Comput. 1999;11:91–101. - PubMed
    1. Aertsen AM, Gerstein GL, Habib MK, Palm G. Dynamics of neuronal firing correlation: modulation of “effective connectivity.”. J Neurophysiol. 1989;61:900–917. - PubMed
    1. Allman J, Miezin F, McGuinness E. Stimulus specific responses from beyond the classical receptive field: neurophysiological mechanisms for local-global comparisons in visual neurons. Annu Rev Neurosci. 1985;8:407–430. - PubMed
    1. Angelucci A, Levitt JB, Walton EJ, Hupe JM, Bullier J, Lund JS. Circuits for local and global signal integration in primary visual cortex. J Neurosci. 2002;22:8633–8646. - PMC - PubMed
    1. Averbeck BB, Latham PE, Pouget A. Neural correlations, population coding and computation. Nat Rev Neurosci. 2006;7:358–366. - PubMed

Publication types

LinkOut - more resources