. 2013 Jan 30;33(5):2039-47.
doi: 10.1523/JNEUROSCI.2201-12.2013.

Bayesian prediction and evaluation in the anterior cingulate cortex

Affiliations

Bayesian prediction and evaluation in the anterior cingulate cortex

Jaime S Ide et al. J Neurosci. .

Abstract

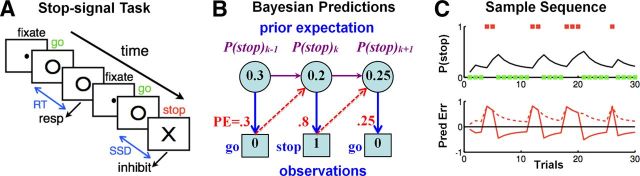
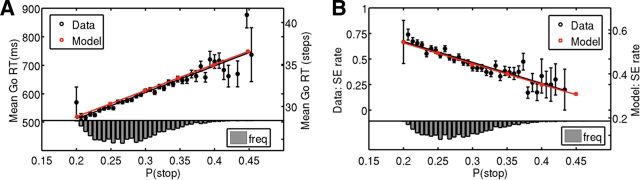
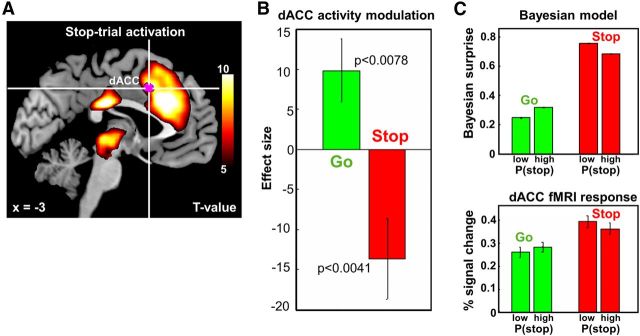
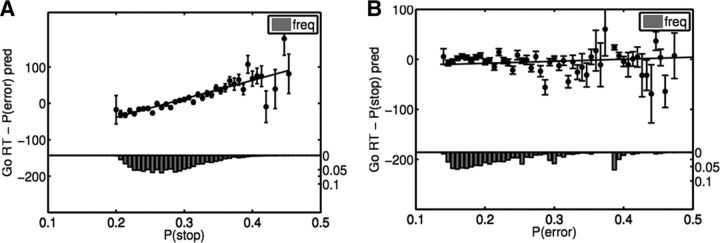
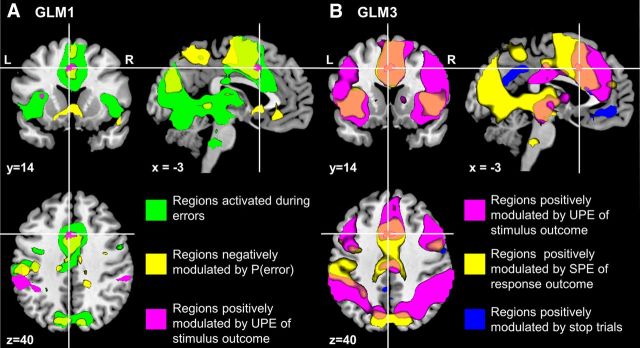
The dorsal anterior cingulate cortex (dACC) has been implicated in a variety of cognitive control functions, among them the monitoring of conflict, error, and volatility, error anticipation, reward learning, and reward prediction errors. In this work, we used a Bayesian ideal observer model, which predicts trial-by-trial probabilistic expectation of stop trials and response errors in the stop-signal task, to differentiate these proposed functions quantitatively. We found that dACC hemodynamic response, as measured by functional magnetic resonance imaging, encodes both the absolute prediction error between stimulus expectation and outcome, and the signed prediction error related to response outcome. After accounting for these factors, dACC has no residual correlation with conflict or error likelihood in the stop-signal task. Consistent with recent monkey neural recording studies, and in contrast with other neuroimaging studies, our work demonstrates that dACC reports at least two different types of prediction errors, and beyond contexts that are limited to reward processing.


Figures

Figure 1.
Figure 1.
Stop signal paradigm and Bayesian sequential prediction. A, In the stop-signal task, subjects begin each trial by fixating a dot, which, after a randomized fore-period (FP), is replaced by a go signal (○); subjects are instructed to press a button at the go signal, unless a stop signal (x) appears after a SSD. Depicted is a go trial followed by a stop trial. B, We use a Bayesian hidden Markov model, specifically a version of the Dynamic Belief Model (Yu and Cohen, 2009), to compute trial-by-trial sequential predictions about stop-signal frequency. The prior probability of a stop signal on trial k, P(stop)k, is combined with the actual outcome (stop = 1, go = 0), to produce a new prior for the next trial k + 1. C, Top, For a sample sequence of go (green square) and stop (red square) trials, Bayesian prior belief about encountering a stop trial (P(stop), black line) increments after each stop trial, and decrements after each go trial. Bottom, The corresponding signed prediction error (solid), stimulus outcome − P(stop), and absolute prediction error (dashed), |stimulus outcome − P(stop)|, as predicted by the Bayesian model, are shown.
Figure 2.
Figure 2.
Bayesian model prediction and behavioral data. A, Bayes-optimal decision-making in the stop-signal task predicts a positive linear relationship between go RT and P(stop) (red squares and line fit). Subjects' go RT positively and linearly correlates with the model estimate of P(stop) on each trial, confirming the prediction. Black circles, mean go RT averaged across subjects for each small bin of P(stop) values; error bars indicate SEM (n = 66); line is best linear regression fit to mean go RT (R2 = 0.83, p < 10−15). Histogram, Empirical distribution of model-estimated P(stop). B, Model predicts a decrease in the SE rate as P(stop) increases, as shown by red squares and line fit. Behavioral data, shown in black, also demonstrate a negative linear relationship between SE rate and model-estimated P(stop). Black circles, error bars, and histogram as in A. Black line is best linear regression fit to SE rate (R2 = 0.88, p < 10−5).
Figure 3.
Figure 3.
Model-based fMRI data analysis: coding of Bayesian surprise in the dACC. A, Hot color, Medial prefrontal cortex, including dACC and pre-SMA, as well as a cluster that includes the thalamus, epithalamus, and regions in the midbrain, is more activated during stop trials than go trials (p < 0.05, corrected for multiple comparisons, FWE). Violet color, The contrast of parametric modulators P(stop) of go trials − P(stop) of stop trials identifies a small cluster in the dACC (675 mm3, peak MNI coordinates [−3 14 40], Z-score = 4.67), bordering SMA, to be more positively modulated by P(stop) in go trials than in stop trials. T-value maps' contrasts are overlaid on structural images in sagittal section, and color bar represents voxel T-values (n = 66). B, Effect size of the parametric modulators P(stop) of dACC masks across 66 subjects (constructed using the first GLM), based on leave-six-out cross-validation. The dACC activity is positively modulated by P(stop) during go trials and negatively modulated during stop trials (p < 0.0078 and p < 0.0041, respectively). C, Top, Bayesian model simulation of surprise, |outcome − P(stop)|, for trials with low and high prior P(stop), each for go (positive correlation) and stop (negative correlation) trials. Bottom, Average PSC of dACC activity for go and stop trials across subjects for the second general linear model. The dACC masks are obtained using the first GLM, followed by a ROI analysis with leave-six-out cross-validation. There is significant increase of dACC activity for different bins across subject in go trials (paired t test, T = 2.004, p = 0.049); there is a significant decrease in stop trials (paired t test, T = 2.662, p = 0.010). We use MarsBaR (http://marsbar.sourceforge.net/) to compute the PSC in the ROI. Error bars indicate SD.
Figure 4.
Figure 4.
Effect of stop signal and error expectancy on RT. A, Go RT is significantly correlated with P(stop) after regressing out the effect of P(error). Black dots show residual go RT for each bin of estimated P(stop) values, averaged across all 66 subjects; error bars indicate SEM; histogram shows fraction of trials in each P(stop) bin. Black line shows best fitting linear regression line (R2 = 0.70, p < 10−10). B, RT is not significantly affected by P(error) after regressing out the effect of P(stop). Black dots show residual go RT for each bin of estimated P(error) values, averaged across all 66 subjects; error bars indicate SEM; histogram shows number of trials in each P(error) bin. Black line is best-fitting linear regression (R2 = 0.03, p = 0.17).
Figure 5.
Figure 5.
Association of the Bayesian surprise in the dACC with expectation of response and stimulus outcomes. Statistical probability maps are obtained with p < 0.0001, uncorrected, and are overlaid on structural images in sagittal, coronal, and axial sections. A, GLM1 was used to model Bayesian surprise or UPE related to P(stop); four categorical types of trials were distinguished according to trial type and outcome: GS, GE, SS, and SE trials. The probability of stop and error trials as estimated by the Bayesian model, or P(stop) and P(error), respectively, and the RT of GS trials were entered as parametric modulators in the model. B, GLM3 was used to isolate activations related to prediction errors associated with response and stimulus outcomes (please see Materials and Methods for details); a single categorical regressor comprised stimulus onset on all trials. Associated with this main regressor were four parametric modulators: Bayesian surprise or UPE of stop (|stimulus outcome − P(stop)|), SPE of error (response outcome − P(error)), stimulus outcome/conflict (stop = 1, go = 0), and response outcome (error = 1, correct = 0), with subsequent modulators orthogonalized with respect to previous ones. Clusters from GLM3 (magenta, blue, and yellow colors) are mostly significant at p < 0.05, corrected.

References

    1. Aarts E, Roelofs A, van Turennout M. Anticipatory activity in anterior cingulate cortex can be independent of conflict and error likelihood. J Neurosci. 2008;28:4671–4678. - PMC - PubMed
    1. Alexander WH, Brown JW. Competition between learned reward and error outcome predictions in anterior cingulate cortex. Neuroimage. 2010;49:3210–3218. - PMC - PubMed
    1. Andersson JL, Hutton C, Ashburner J, Turner R, Friston K. Modeling geometric deformations in EPI time series. Neuroimage. 2001;13:903–919. - PubMed
    1. Ashburner J, Friston KJ. Unified segmentation. Neuroimage. 2005;26:839–851. - PubMed
    1. Aston-Jones G, Cohen JD. An integrative theory of locus coeruleus-norepinephrine function: adaptive gain and optimal performance. Annu Rev Neurosci. 2005;28:403–450. - PubMed

Publication types