. 2013 Jan 30;33(5):2087-96.
doi: 10.1523/JNEUROSCI.3880-12.2013.

Chronic inactivation of a neural circuit enhances LTP by inducing silent synapse formation

Affiliations

Chronic inactivation of a neural circuit enhances LTP by inducing silent synapse formation

Kristin L Arendt et al. J Neurosci. .

Abstract

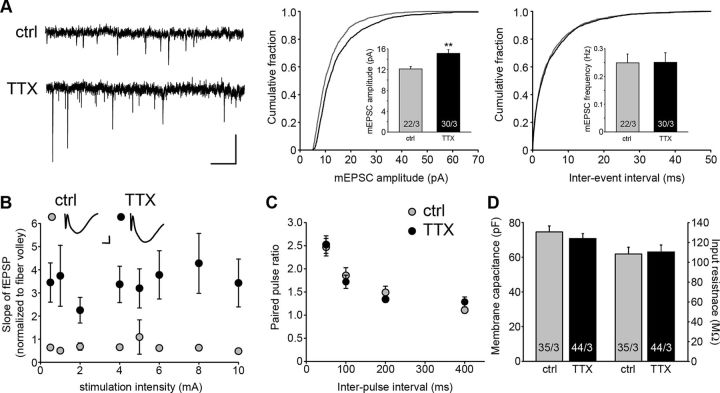
Chronic inactivation of a neural network is known to induce homeostatic upregulation of synaptic strength, a form of synaptic plasticity that differs from Hebbian-type synaptic plasticity in that it is not input-specific, but involves all synapses of an individual neuron. However, it is unclear how homeostatic and Hebbian synaptic plasticity interact in the same neuron. Here we show that long-term potentiation (LTP) at Schaffer collateral-CA1 synapses is greatly enhanced in cultured mouse hippocampal slices after chronic (60 h) network-activity blockade with tetrodotoxin (TTX). This increase in LTP is not due to an altered synaptic NMDA receptor composition or presynaptic function. Instead, we found that silencing neural network activity not only increases the abundance of both AMPA and NMDA receptors at existing synapses as previously described, but also promotes the presence of new glutamatergic synapses that contain only NMDA receptors-a class of synapses that are functionally silent due to the absence of AMPA receptors. Induction of LTP in TTX-treated neurons leads to insertion of AMPA receptors into the silent synapses, thereby "switching on" these silent synapses, which produces the observed enhancement of LTP magnitude. Our findings suggest that homeostatic synaptic plasticity manifests not only in the adjustment of the strength of existing synapses, but also in the modulation of new synapse formation/maintenance. Moreover, presence of new but functionally silent synapses enables more robust LTP to occur through rapid conversion of silent synapses to active synapses, resulting in a stronger input-specific modulation of synapses following prolonged network silencing.


Figures

Figure 1.
Figure 1.
TTX scaling increases the magnitude of long-term potentiation. A, Example traces of evoked EPSCs at CA3–CA1 pyramidal neuron synapses before (gray) and 50–60 min after (black) LTP induction in the presence or absence of APV. Examples from 60 h vehicle or TTX treatment are shown. Calibration: 50 pA, 10 ms. B, Average EPSCs during LTP experiments. LTP was induced in the presence or absence of bath-applied APV with the pairing protocol (see Materials and Methods) in vehicle or TTX-treated slices (TTX was washed out before recording was achieved). Compared with their baseline values, significant potentiation for the control (ctrl) group and the TTX group was observed (p < 0.0001, paired t test; N numbers are shown as number of cells/number of independent experiments). A significant difference in the magnitude of LTP was observed between the control group and the TTX (p < 0.001). C, Quantification of the magnitude of LTP at 60–70 min postinduction (**p < 0.01; ***p < 0.001). D, Cumulative distribution of the magnitude of LTP for all cells in B and C.
Figure 2.
Figure 2.
TTX scaling increases basal AMPA-receptor-mediated transmission. A, Miniature excitatory transmission for control and TTX-treated cells. Quantification of the average miniature amplitude (**p < 0.01) and frequency (p > 0.9) for control (ctrl) and TTX-treated neurons. Calibration: 10 pA, 1 s. B, Evoked fEPSP input/output curve for control and TTX-treated slices across a range of stimulation intensities. Slope of the fEPSP was normalized to the presynaptic fiber volley. Significant difference was observed at all points for TTX compared with control (p < 0.001, n = 16–27/3). Inset, Example waveforms of fEPSP recorded from control and TTX-treated slices. Calibration: 0.1 mV, 1 ms. C, Paired pulse ratio for cells treated with TTX or vehicle reveals no difference in presynaptic properties (p > 0.5, n = 11–13/3). D, Passive membrane properties of both experimental groups (p > 0.4).
Figure 3.
Figure 3.
TTX-scaled hippocampal pyramidal neurons have increased AMPA- and NMDA-receptor-mediated transmission. A, Example traces of evoked synaptic AMPA and NMDA currents and quantification of the evoked AMPA/NMDAR ratio (p > 0.5). Calibration: 50 pA, 20 ms. B, Example traces of dual-component mEPSCs. Calibration: 4 pA, 10 ms. C, Quantification of the AMPAR mEPSCs and NMDAR mEPSCs (**p < 0.01, ***p < 0.001) for control (ctrl) and TTX cells.
Figure 4.
Figure 4.
TTX treatment does not change synaptic NMDA receptor composition. A, Example traces of evoked NMDA currents before (black) and after (gray) blockade of NR2B current via ifenprodil (30 μm). Calibration: 20 pA, 40 ms. Quantification of peak NMDA current blockade is shown for control (ctrl) and TTX-treated cells. B, NMDA receptor-dependent LTP in the presence of ifenprodil for both control and TTX-treated neurons. C, Quantification of the magnitude of LTP in the presence and absence of ifenprodil for control and TTX-treated cells (*p < 0.05; **p < 0.01). D, The percentage LTP blockade by ifenprodil is comparable for the two groups (p > 0.4).
Figure 5.
Figure 5.
TTX treatment promotes silent synapse formation. A, Example traces and scatter plot of evoked EPSCs from one control pyramidal neuron at −60 and +40 mV holding potentials. Failed events were assigned with an amplitude of 0 pA for ease of visualization. B, Same as A, except the recordings were done in a TTX-treated neuron. Calibration: A, B, 20 pA, 10 ms. C, Cumulative amplitude histogram of the eEPSC amplitude at −60 mV from the control (ctrl) and TTX-treated cells shown in A and B. Note the threshold for success is 10 pA. D, Cumulative amplitude histogram of the eEPSC amplitude at +40 mV from the two cells shown in A and B. Note the threshold for success is 20 pA. E, Quantification of failure rate of evoked response for control and TTX-treated cells at −60 and +40 mV holding potentials. Failure rate is calculated from 50 sweeps per cell. Significant reduction in failure rate was observed for TTX-treated cells (***p < 0.001).
Figure 6.
Figure 6.
TTX treatment increased NMDAR- but not AMPAR-containing synapses. A, Immunostaining of VGluT1 and GluN1 in 14 DIV primary hippocampal cultures treated with vehicle (ctrl) or TTX for 48 h. Scale bar, 10 μm. B, Quantification of synaptic (VGluT1-positive) GluA1 puncta size and integrated intensity (***p < 0.001; N number indicates number of neurons/number of independent experiments). C, Quantification of synaptic GluN1 puncta size and integrated intensity (***p < 0.001). D, Zoomed in images of VGluT1 and GluN1 staining taken from the boxed areas in A. Scale bar, 5 μm. E, Quantification of density of all excitatory synapses (VGluT1 density), AMPAR-containing synapses (synaptic GluA1 density), and NMDAR-containing synapses (synaptic GluN1 density) **p < 0.01; ***p < 0.001; N number indicate number of neurons/number of independent experiments).
Figure 7.
Figure 7.
LTP induction in TTX-treated neurons converts silent synapses to active ones. A, Example mEPSC traces from control (ctrl) and TTX-treated cells during baseline and post-LTP induction period. Calibration: 20 pA, 1 s. B, C, Quantification of mEPSC amplitude and frequency during baseline and post-LTP induction period in control and TTX-treated cells (*p < 0.05; ***p < 0.001). D, Quantification of paired-pulse ratio during baseline and after induction for control cells (n = 14 and 13, respectively) and TTX-treated cells (n = 11 and 12, respectively). E, Quantification of failure rate for control and TTX-treated cells following LTP induction at −60 and +40 mV holding potentials.
Figure 8.
Figure 8.
A schematic diagram depicting the mechanism by which network silencing influences LTP.

References

    1. Abraham WC, Bear MF. Metaplasticity: the plasticity of synaptic plasticity. Trends Neurosci. 1996;19:126–130. - PubMed
    1. Barria A, Malinow R. NMDA receptor subunit composition controls synaptic plasticity by regulating binding to CaMKII. Neuron. 2005;48:289–301. - PubMed
    1. Bear MF, Rittenhouse CD. Molecular basis for induction of ocular dominance plasticity. J Neurobiol. 1999;41:83–91. - PubMed
    1. Berardi N, Pizzorusso T, Ratto GM, Maffei L. Molecular basis of plasticity in the visual cortex. Trends Neurosci. 2003;26:369–378. - PubMed
    1. Chevaleyre V, Castillo PE. Endocannabinoid-mediated metaplasticity in the hippocampus. Neuron. 2004;43:871–881. - PubMed

Publication types

MeSH terms