. 2013 Jan 30;33(5):2097-107.
doi: 10.1523/JNEUROSCI.3454-12.2013.

Complex movement topography and extrinsic space representation in the rat forelimb motor cortex as defined by long-duration intracortical microstimulation

Affiliations

Complex movement topography and extrinsic space representation in the rat forelimb motor cortex as defined by long-duration intracortical microstimulation

Laura Bonazzi et al. J Neurosci. .

Abstract

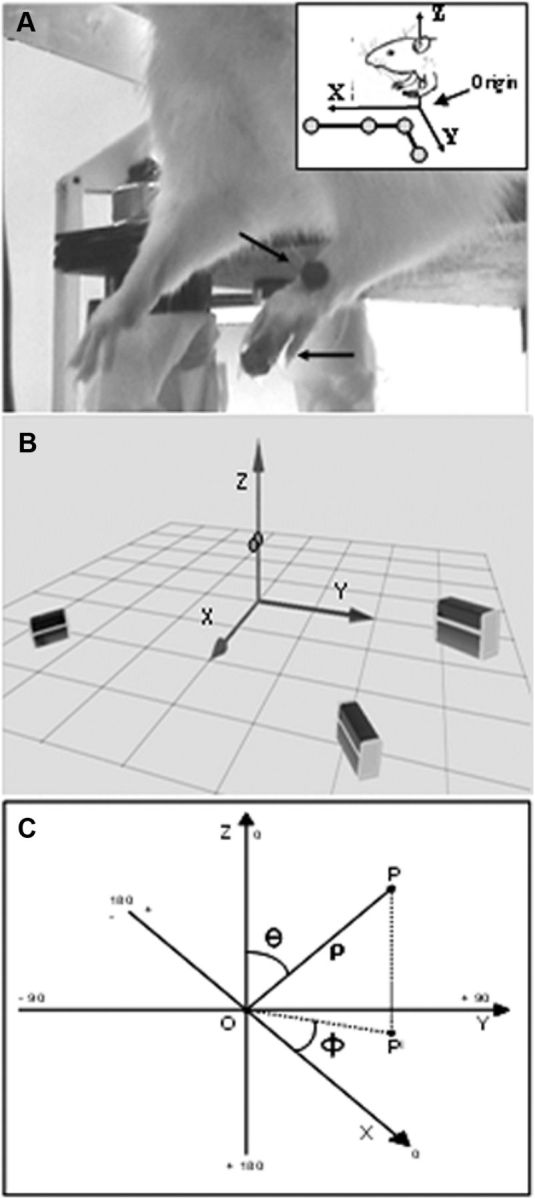
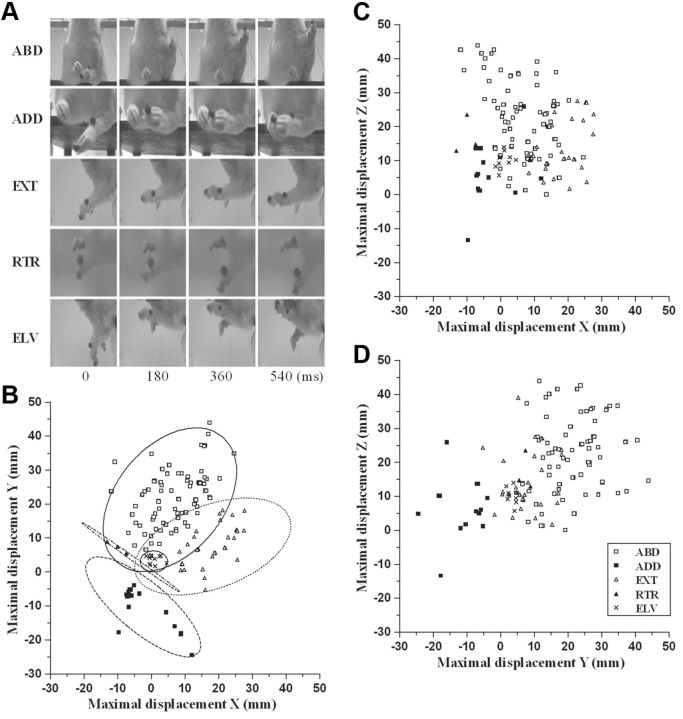
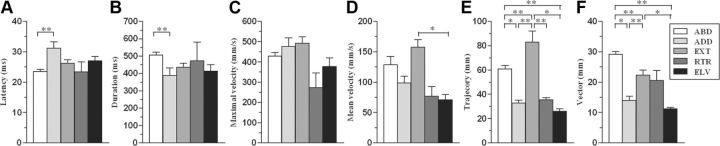
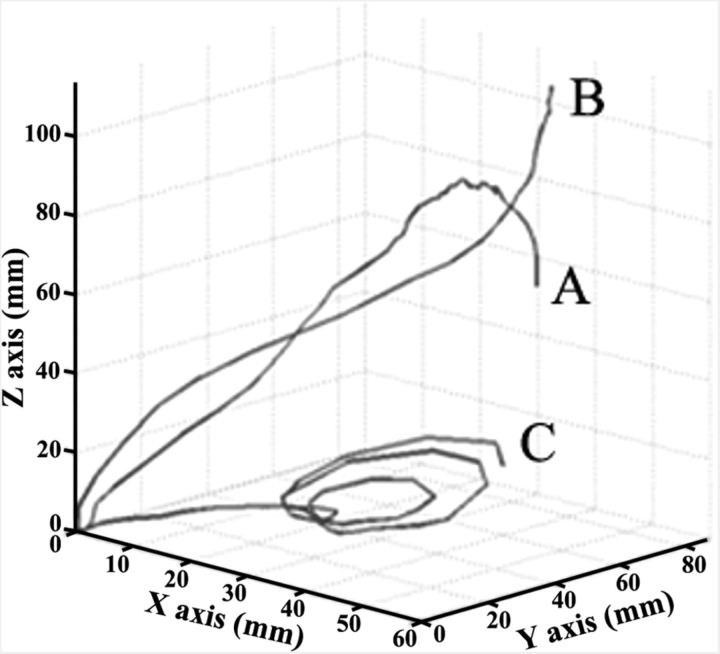
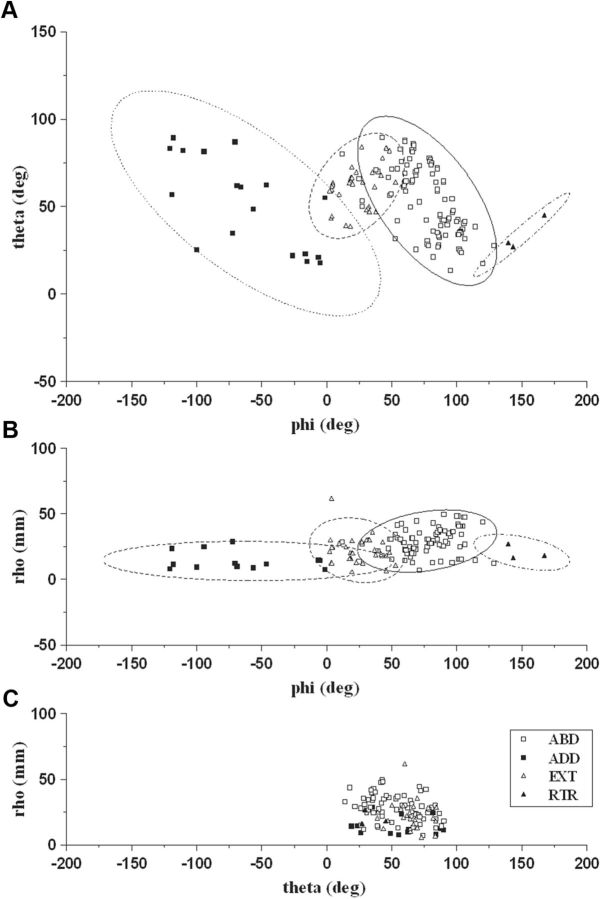
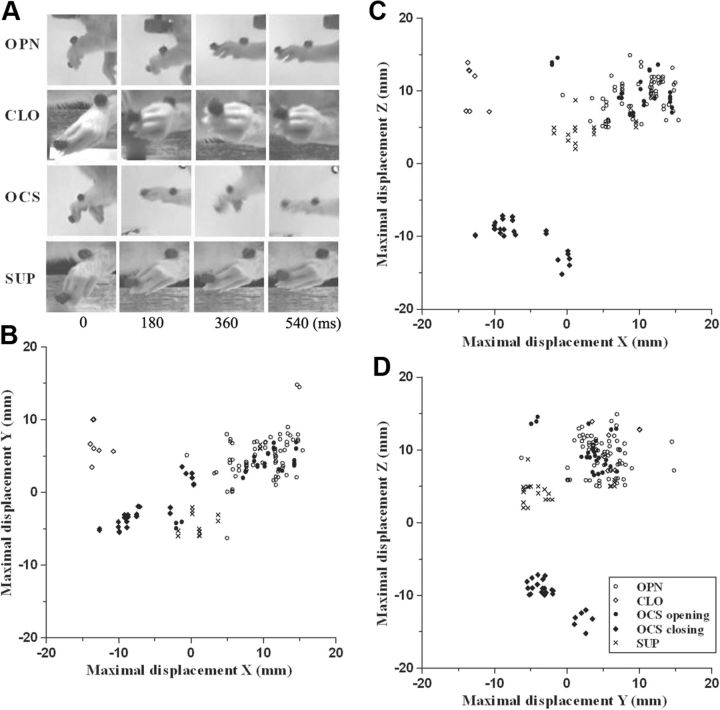
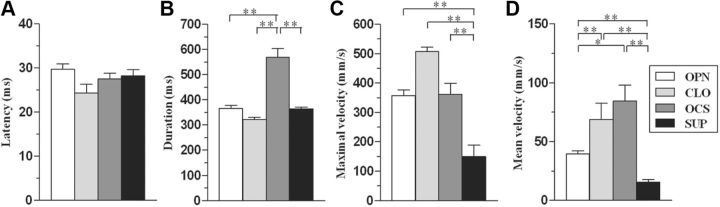
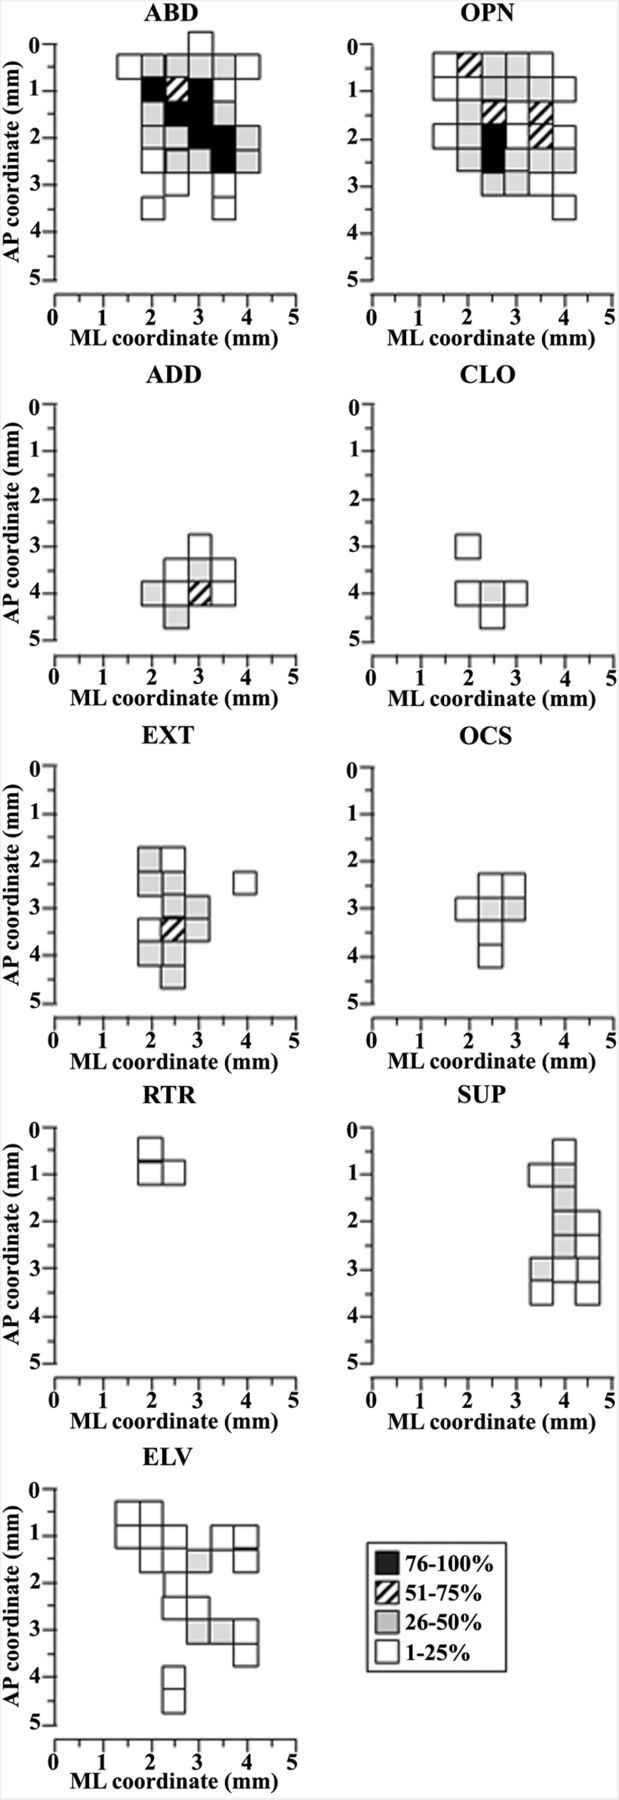
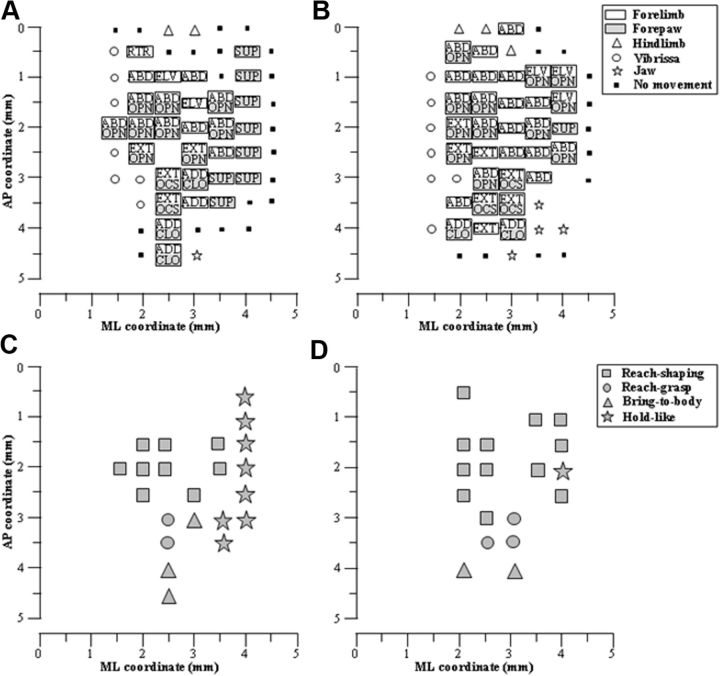
Electrical stimulation of the motor cortex in the rat can evoke complex forelimb multi-joint movements, including movement of limb and paw. In this study, these movements have been quantified in terms of 3D displacement and kinematic variables of two markers positioned on the wrist and middle digits (limb and paw movement, respectively). Electrical microstimulation was applied to the motor cortex using a pulse train of 500 ms duration. Movements were measured using a high-resolution 3D optical system. Five classes of limb movements (abduction, adduction, extension, retraction, elevation) and four classes of paw movements (opening, closure, opening/closure sequence, supination) were described according to their kinematics. A consistent topography of these classes of movements was presented across the motor cortex together with a topography of spatial locations to which the paw was directed. In about one-half of cortical sites, a specific pattern of limb-paw movement combination did exist. Four categories of limb-paw movements resembling behavioral repertoire were identified: reach-shaping, reach-grasp sequence, bring-to-body, and hold-like movement. Overall, the forelimb motor region included: (1) a large caudal forelimb area dominated by reach-shaping movement representation; (2) a small rostral area containing reach-grasp sequence and bring-to-body movement representation; and (3) a more lateral portion where hold-like movement was represented. These results support the view that, in rats, the motor cortex controls forelimb movements at a relatively complex level and suggest that the orderly representation of complex movements and their dynamics/kinematics emerge from the principles of forelimb motor cortex organization.


Figures

Figure 1.
Figure 1.
Experimental setup and coordinates system. A, Placement of the reflective markers and forelimbs resting position hanging free. The stationary L-shaped reference structure (top right box) with its four markers defined the origin and orientation of the coordinate system. B, Reconstruction of the real experimental space showing the cameras and markers position. The three cameras were positioned to allow each camera to detect the markers (suspended circles) simultaneously. C, Spherical coordinate system is illustrated for the 3D evaluation of movement direction. Spherical coordinates of a given point P in the XYZ space were defined as follows: rho (ρ) was the distance between P and O. In the present data ρ was the movement vector; all vectors were made to originate from the intersection of axes; phi (ϕ) was the angle between the positive X-axis and OPI; counterclockwise was considered the positive direction (ϕ, between 0 and ±180°); theta (θ) was the angle between the z-axis and OP (θ, between 0 and 180°).
Figure 2.
Figure 2.
Limb movement classification according to video recording and to maximum displacement. A, Sequences of pictures taken from video recordings when limb movement was elicited. In each sequence, the picture on the left shows the position of the limb at the beginning of the movement (0 ms); in others the position of the limb is represented in steps of 180 ms. See Table 1 for movement classes. BD, Scatter plots displaying maximal displacement in X-, Y-, and Z-axes for limb movements for all animals. Individual data were represented by a symbol in 2D space, where axes represent the variables (A, X vs Y; B, X vs Z; C, Y vs. Z). The plot in B visualized the class of movements as a cluster of points highlighted by the confidence ellipsoids (95% confidence limits). See Table 1 for classes of limb movement.
Figure 3.
Figure 3.
Kinematic variables calculated from the wrist marker during the limb movement. Each histogram shows a kinematic variable (A, Latency; B, duration; C, maximal velocity; D, mean velocity, E, trajectory; F: vector) versus classes of movement (see Table 1). Data are means ± SEM. of n determinations per class; *p < 0.05; **p < 0.01, different from other.
Figure 4.
Figure 4.
Three-dimensional representation of trajectories with path indices >1.57 and different shapes. A, C-shaped; B, S-shaped; C, coil-like-shaped. All trajectories began at 0,0,0. Note that the scales are not equivalent on each axis; it improves the legibility of the graph but decreases the curvature impression (Z-axis has been less expanded).
Figure 5.
Figure 5.
A, Representative spatial distribution of the limb endpoints in two animals. Schemes of the lateral (left) and frontal (right) views of the rat are drawn from a video frame with the limb in starting position. The filled gray circles represent the wrist marker placed at the intersection of the Cartesian axes; other symbols represent the final endpoint positions of the stimulation-evoked limb movements. EXT and ELV endpoints are visualized in the lateral scheme (maximal displacement in X vs Z), and ABD and ADD endpoints are visualized in the frontal scheme (maximal displacement in Y vs Z). B, Representative 3D plot of final limb endpoint locations evoked in one animal. Classes of movement were symbol coded while small full dots were the starting points. Final endpoint locations were different for each class of movement. Note that in this panel, scales are different for each axis to improve legibility.
Figure 6.
Figure 6.
AC, Two-dimensional scatter plot of spherical coordinates showing the movement endpoint locations across animals. Since ELV was only vertically upward on the Z-axis (maximal displacement in X- and Y-axes, <4 mm), it was not displayed in these plots. Individual data were represented by a symbol in 2D space, where axes represent the variables (A, phi vs theta; B, phi vs rho; C, theta vs rho). Plots A and B visualized the movement endpoints as a cluster of points highlighted by the confidence ellipsoids (95% confidence limits).
Figure 7.
Figure 7.
Paw movement classification according to video recording and to maximum displacement. A, Sequences of pictures taken from a video recording when paw movement was elicited. In each sequence, the picture on the left shows the position of the paw at the beginning of the movement (0 ms); in other pictures, the position of the paw is represented in steps of 180 ms. See Table 1 for movement classes. BD, Scatter plots displaying maximal displacement in X-, Y-, and Z-axes for all of the digit marker movements for different animals. Individual data were represented by a point in 2D space where axes represent the variables (B, X vs Y; C, X vs Z; D, Y vs Z). Worthy of note is the overlapping of the OPN and OCS opening phase points in all three plots and the clustering of CLO and OCS closing phase points in B and C.
Figure 8.
Figure 8.
Kinematic variables calculated from the digit marker during the paw movement. Each histogram shows a kinematic variable (A, Latency; B, duration; C, maximal velocity; D, mean velocity) versus classes of movement (see Table 1). Data are means ± SEM of n determinations per class. *p < 0.05; **p < 0.01, different from other.
Figure 9.
Figure 9.
Description of limb and paw movements according to the distribution of sites across the cortical surface. Surface plots show the frequency distribution of sites at each coordinate relative to the bregma. Interpenetration distances were 500 μm. The microelectrode was sequentially introduced to a depth of 1500 μm, and movements were evoked with stimulation intensity of 100 μA. In this M1 mapping scheme, the frontal pole was at the bottom and 0 corresponded to the bregma; numbers indicated rostral or caudal distance from the bregma or lateral distance from the midline (ML). The frequency movement at each site is coded by different gray levels. One hundred percent probability is achieved when a movement at that site was observed in all seven animals. Left column, Limb movement classes, animal n = 7, sites n = 177. Right column, Paw movement classes, animal n = 7, sites n = 124.
Figure 10.
Figure 10.
A, B, Representative arrangement of limb and paw movement sites across the cortical surface in two animals. Absence of any symbol indicates that penetration was not performed due to the presence of a large vessel. Non-forelimb movement observed simultaneously with forelimb movements was not shown. See Tab. 1 for movement classes. C, D, Topographic arrangement of stimulation effects in the same animals shown above, where sites are symbol coded according to the ethological category of movement evoked. Sites where stimulation failed to produce paw movement were excluded. In the schemes, the frontal pole was at the bottom and 0 corresponded to the bregma; numbers indicated rostral or caudal distance from the bregma or lateral distance from the midline.

References

    1. Adamovich SV, Archambault PS, Ghafouri M, Levin MF, Poizner H, Feldman AG. Hand trajectory invariance in reaching movements involving the trunk. Exp Brain Res. 2001;138:288–303. - PubMed
    1. Archambault P, Pigeon P, Feldman AG, Levin MF. Recruitment and sequencing of different degrees of freedom during pointing movements involving the trunk in healthy and hemiparetic subjects. Exp Brain Res. 1999;126:55–67. - PubMed
    1. Asanuma H, Arnold A, Zarzecki P. Further study on the excitation of pyramidal tract cells by intracortical microstimulation. Exp Brain Res. 1976;26:443–461. - PubMed
    1. Brecht M, Preilowski B, Merzenich MM. Functional architecture of the mystacial vibrissae. Behav Brain Res. 1997;84:81–97. - PubMed
    1. Brown SP, Hestrin S. Intracortical circuits of pyramidal neurons reflect their long-range axonal targets. Nature. 2009;457:1133–1136. - PMC - PubMed

Publication types

LinkOut - more resources