. 2013 Jan 30;33(5):2147-55.
doi: 10.1523/JNEUROSCI.4437-12.2013.

Brain microstructure reveals early abnormalities more than two years prior to clinical progression from mild cognitive impairment to Alzheimer's disease

Affiliations

Brain microstructure reveals early abnormalities more than two years prior to clinical progression from mild cognitive impairment to Alzheimer's disease

Gwenaëlle Douaud et al. J Neurosci. .

Abstract

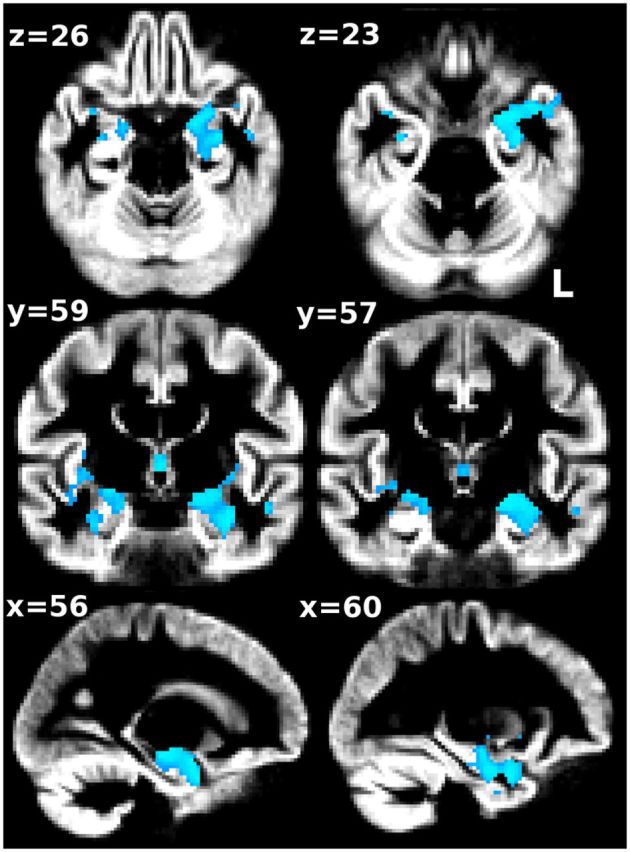
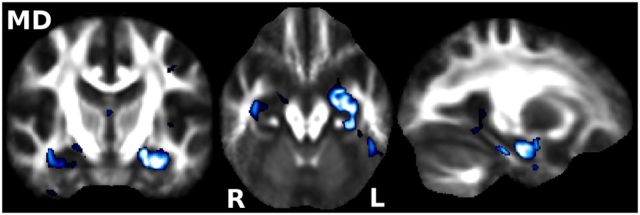
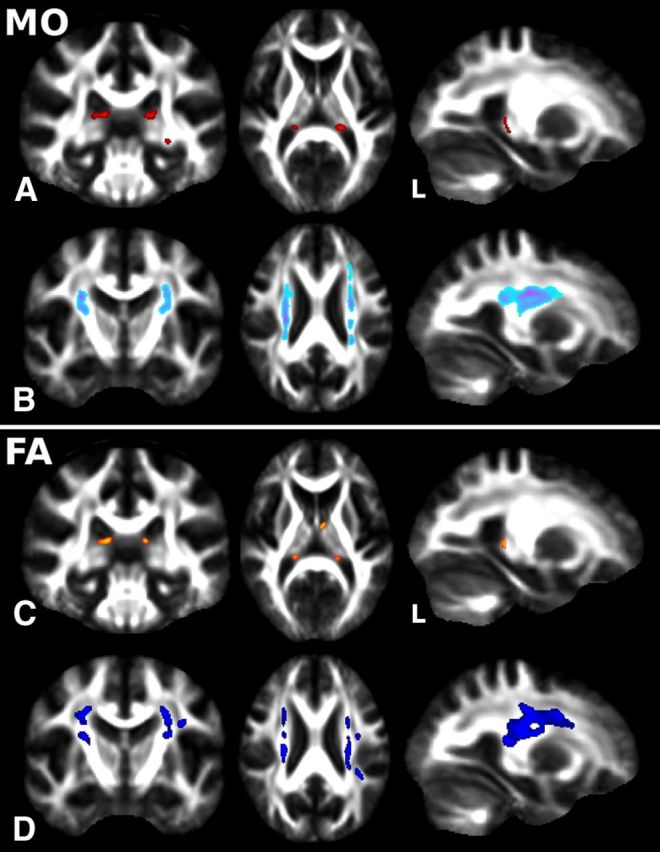
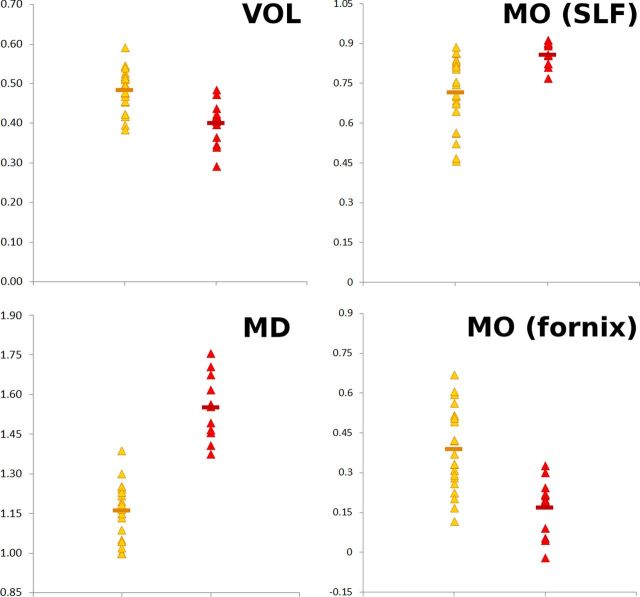
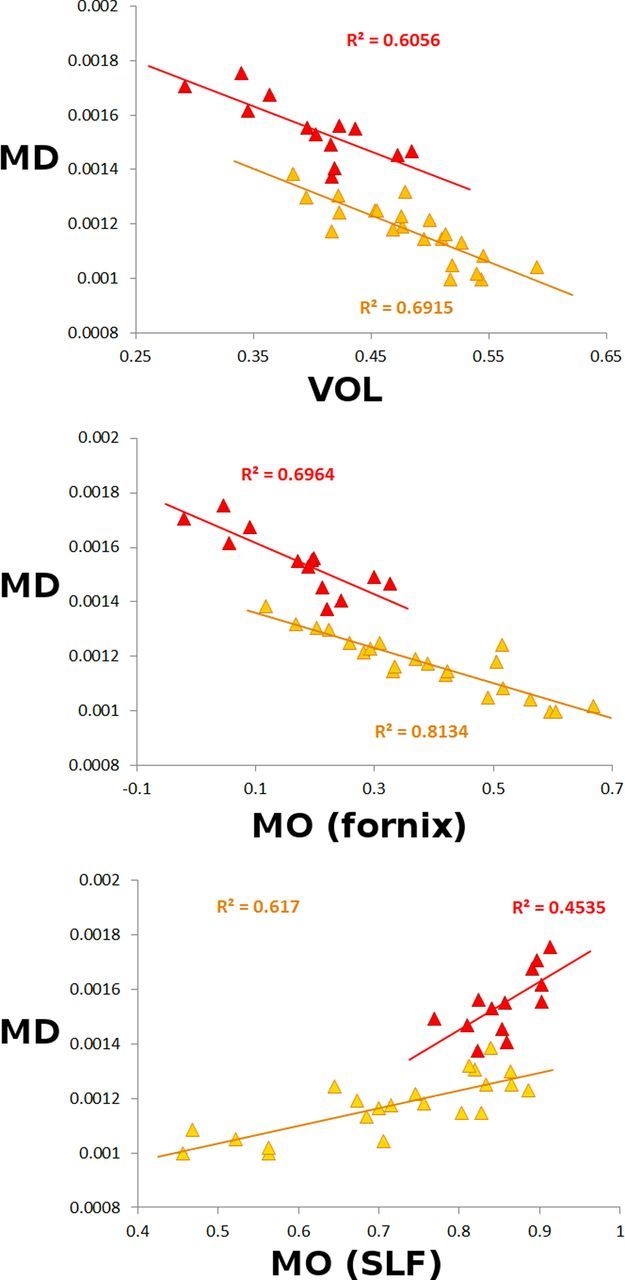
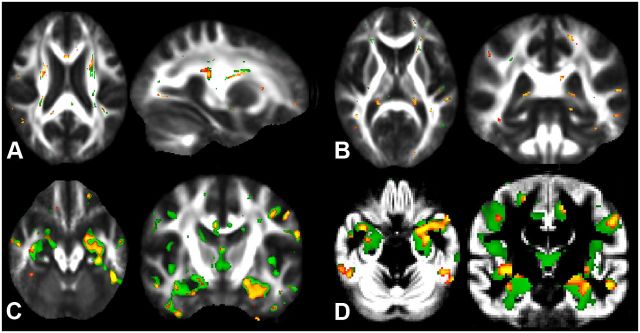
Diffusion imaging is a promising marker of microstructural damage in neurodegenerative disorders, but interpretation of its relationship with underlying neuropathology can be complex. Here, we examined both volumetric and brain microstructure abnormalities in 13 amnestic patients with mild cognitive impairment (MCI), who progressed to probable Alzheimer's disease (AD) no earlier than 2 years after baseline scanning, in order to focus on early, and hence more sensitive, imaging markers. We compared them to 22 stable amnestic MCI patients with similar cognitive performance and episodic memory impairment but who did not show progression of symptoms for at least 3 years. Significant group differences were mainly found in the volume and microstructure of the left hippocampus, while white matter group differences were also found in the body of the fornix, left fimbria, and superior longitudinal fasciculus (SLF). Diffusion index abnormalities in the SLF were the sign of a subtle microstructural injury not detected by standard atrophy measures in the corresponding gray matter regions. The microstructural measure obtained in the left hippocampus using diffusion imaging showed the most substantial differences between the two groups and was the best single predictor of future progression to AD. An optimal prediction model (91% accuracy, 85% sensitivity, 96% specificity) was obtained by combining MRI measures and CSF protein biomarkers. These results highlight the benefit of using the information of brain microstructural damage, in addition to traditional gray matter volume, to detect early, subtle abnormalities in MCI prior to clinical progression to probable AD and, in combination with CSF markers, to accurately predict such progression.


Figures

Figure 1.
Figure 1.
Whole-brain significant GM volume differences at baseline between pMCI and sMCI. Despite the pMCI patients being scanned on average 2.5 years prior to their clinical progression to AD, the FSL-VBM analysis revealed significantly smaller GM volume essentially in the left amygdalo-hippocampal complex compared with sMCI (p < 0.01 corrected for multiple comparisons). Results are overlaid onto the average of all nonlinearly registered GM segmentations. Radiological convention (left is right).
Figure 2.
Figure 2.
Voxel-based (as opposed to “skeletonized”) significant MD differences at baseline. Traditional voxel-based analysis revealed markedly higher MD in pMCI primarily localized to the left amygdalo-hippocampal complex (p < 0.05 corrected for multiple comparisons). Results are overlaid onto the average of all nonlinearly registered FA images. Radiological convention (left is right).
Figure 3.
Figure 3.
Whole-brain significant WM “skeletonized” MO and FA differences between pMCI and sMCI groups at baseline. A, B, TBSS revealed significant differences at baseline between pMCI and sMCI with lower MO in the body of the fornix extending to the left fimbria (A, in red) and higher MO in the centrum semiovale where SLF and CST cross (B, in light blue-purple) (p < 0.05 corrected for multiple comparisons). C, D, FA exhibited the same qualitative changes than MO (C, lower FA in orange; D, higher FA in dark blue), although these were just below the statistical threshold (p < 0.08 corrected for multiple comparisons). Radiological convention (left is right).
Figure 4.
Figure 4.
All significant MRI-derived measures in sMCI (yellow) and pMCI (red). Values obtained in those regions showing significant differences between the pMCI and sMCI: VOL, GM volume smaller in pMCI essentially in the left hippocampus; MO (SLF), mode of anisotropy higher in pMCI in the SLF; MO (fornix), mode of anisotropy lower in pMCI in the fornix; MD, mean diffusivity higher in pMCI essentially in the left hippocampus (×10−9 m2 · s−1).
Figure 5.
Figure 5.
Scatterplots of all significant MRI-derived measures in sMCI (yellow) and pMCI (red). MD values (essentially from the left hippocampus) are plotted against the following: Top, GM volume (VOL) essentially from the left hippocampus; Middle, MO from the fornix; Bottom, MO from the SLF. Top, The relationship between VOL and MD (×10−6 m2 · s−1) demonstrated a very fine stratification of the two groups with comparable slopes when fitting a linear model for each group considered independently. Middle, The relationship between lower MO and MD showed a slightly steeper slope for the pMCI group when fitting a linear model for each group independently (p = 0.017). Bottom, The relationship between higher MO and MD clearly showed a steeper slope for the pMCI group (p = 0.004).
Figure 6.
Figure 6.
Whole-brain group comparisons between pMCI and sMCI, after excluding nine sMCI participants from the analyses to match the groups for age and gender. Despite an inherent loss of statistical power in the statistical model due to the loss of these nine subjects, the spatial pattern of the results for each modality was extremely similar between the analyses with the larger dataset (in green) and the reduced, age-matched dataset (in orange). A, Higher MO values; B, lower MO values; C, higher MD values; and D, smaller GM volume in pMCI compared with sMCI (p < 0.05 uncorrected, except for C: p < 0.01, uncorrected).

Similar articles

Cited by

References

    1. Agosta F, Pievani M, Sala S, Geroldi C, Galluzzi S, Frisoni GB, Filippi M. White matter damage in Alzheimer disease and its relationship to gray matter atrophy. Radiology. 2011;258:853–863. - PubMed
    1. American Psychiatric Association. Diagnostic and statistical manual of mental disorders: DSM-IV. Washington, DC: American Psychiatric Association; 1994.
    1. Amunts K, Kedo O, Kindler M, Pieperhoff P, Mohlberg H, Shah NJ, Habel U, Schneider F, Zilles K. Cytoarchitectonic mapping of the human amygdala, hippocampal region and entorhinal cortex: intersubject variability and probability maps. Anat Embryol (Berl) 2005;210:343–352. - PubMed
    1. Buckner RL, Snyder AZ, Shannon BJ, LaRossa G, Sachs R, Fotenos AF, Sheline YI, Klunk WE, Mathis CA, Morris JC, Mintun MA. Molecular, structural, and functional characterization of Alzheimer's disease: evidence for a relationship between default activity, amyloid, and memory. J Neurosci. 2005;25:7709–7717. - PMC - PubMed
    1. Buckner RL, Sepulcre J, Talukdar T, Krienen FM, Liu H, Hedden T, Andrews-Hanna JR, Sperling RA, Johnson KA. Cortical hubs revealed by intrinsic functional connectivity: mapping, assessment of stability, and relation to Alzheimer's disease. J Neurosci. 2009;29:1860–1873. - PMC - PubMed

Publication types

MeSH terms

LinkOut - more resources