. 2013 Jan 30;33(5):2156-65.
doi: 10.1523/JNEUROSCI.3495-12.2013.

Functional impact of dendritic branch-point morphology

Affiliations

Functional impact of dendritic branch-point morphology

Michele Ferrante et al. J Neurosci. .

Abstract

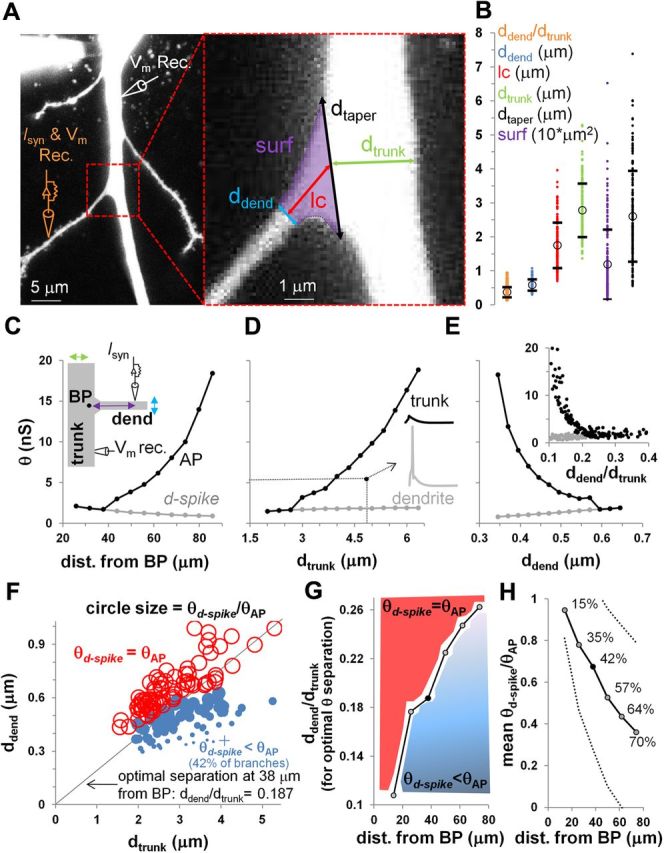
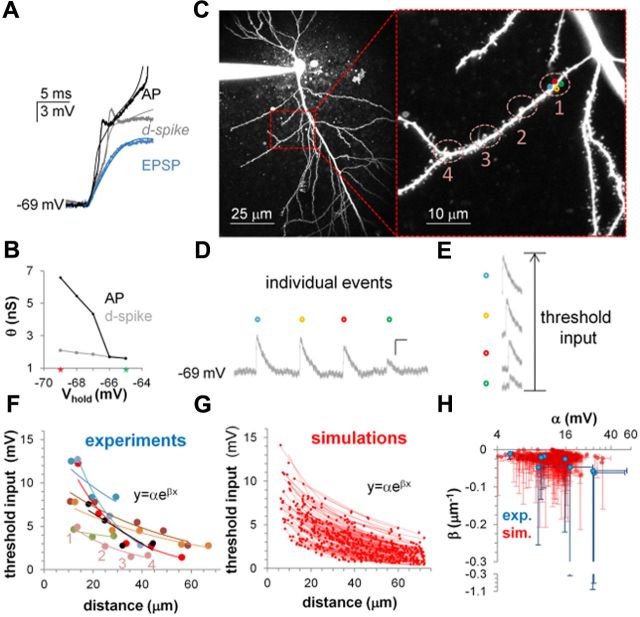
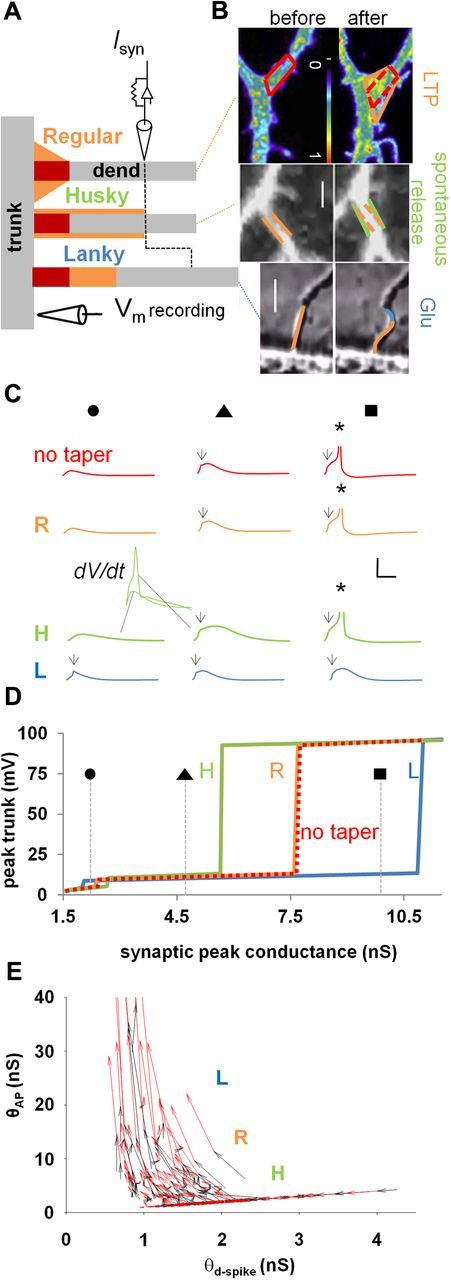
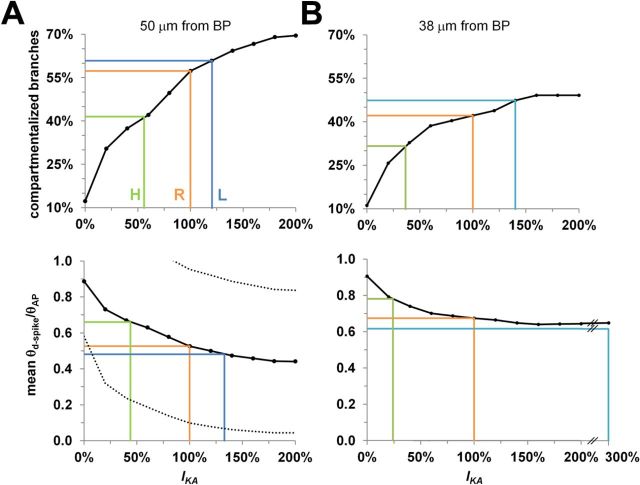
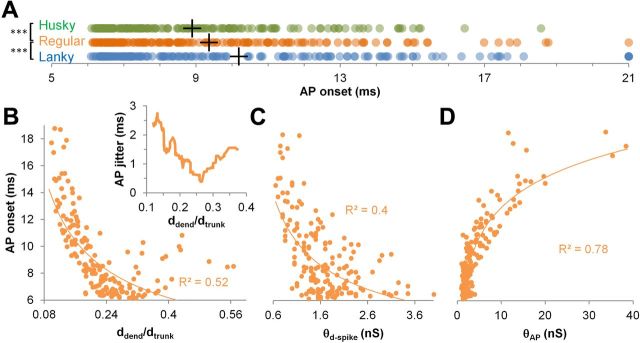
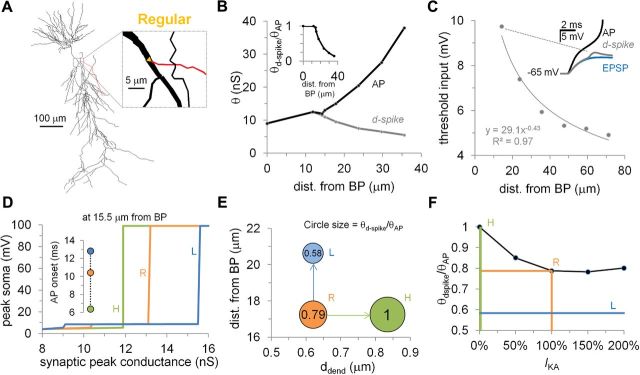
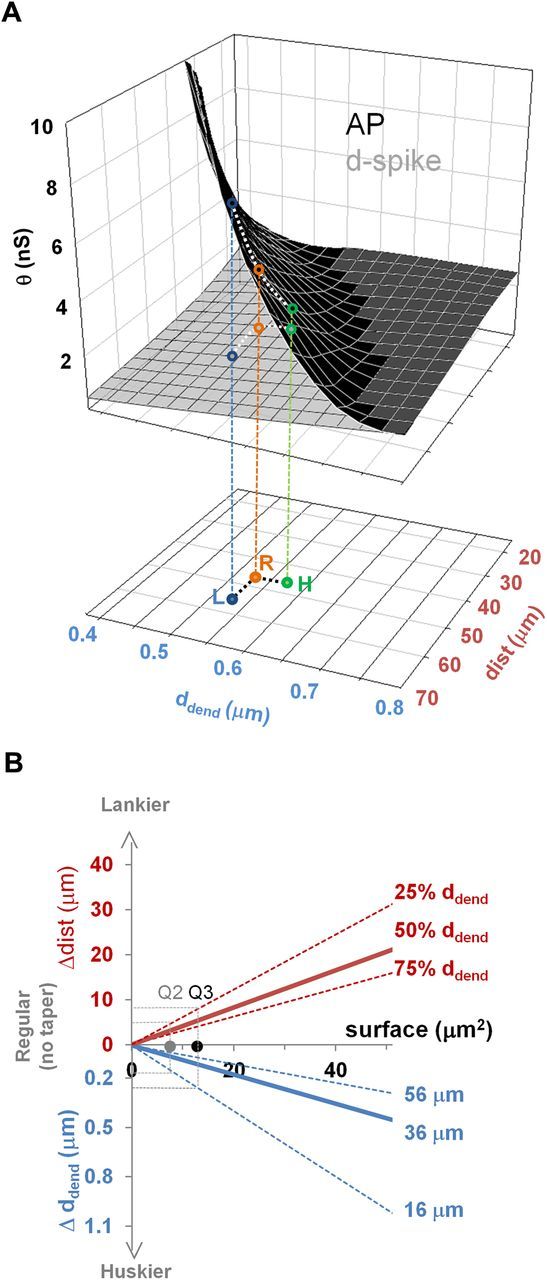
Cortical pyramidal cells store multiple features of complex synaptic input in individual dendritic branches and independently regulate the coupling between dendritic and somatic spikes. Branch points in apical trees exhibit wide ranges of sizes and shapes, and the large diameter ratio between trunk and oblique dendrites exacerbates impedance mismatch. The morphological diversity of dendritic bifurcations could thus locally tune neuronal excitability and signal integration. However, these aspects have never been investigated. Here, we first quantified the morphological variability of branch points from two-photon images of rat CA1 pyramidal neurons. We then investigated the geometrical features affecting spike initiation, propagation, and timing with a computational model validated by glutamate uncaging experiments. The results suggest that even subtle membrane readjustments at branch points could drastically alter the ability of synaptic input to generate, propagate, and time action potentials.


Figures

Figure 1.
Figure 1.
Branch-point (BP) morphology affects the thresholds for dendritic and somatic spike generation. A, Left, Representative confocal image illustrating the simulation setup (orange, stimulating and recording electrode; white, recording electrode). Right, Expanded view of the bifurcation between the main trunk and the oblique branch, with the measured morphometric parameters: ddend, dtrunk, surf, and lc. B, Parameter distributions for the 171 branches measured from image stacks; circles and horizontal lines mark averages and SDs, respectively. C–E, Stimulation threshold (θ) to generate a local d-spike (gray line) or an AP in the trunk (black line) in the computational model, as a function of the distance of the input from the branch point (C), the trunk diameter (D), the diameter of the oblique dendrite (E), and the oblique/trunk diameter ratio (inset in E). The inset in C depicts a schematic of the computational model in which purple, green, and blue arrows show the manipulated parameters in C, D, and E, respectively. The inset in D shows dendritic and trunk voltage traces during a 5 nS synaptic stimulation at 38 μm from the branch point. Except for the independent variables in each of the main panels, average branch morphometric values (B) and a 38 μm synaptic distance from the branch point were used for all parameters. In contrast, the inset in E used the original values extracted from the 171 bifurcations. F, Linear discriminant analysis identifies, for a specific synaptic distance from the branch point (38 μm), the optimal ddend/dtrunk diameter ratio allowing thresholds separation. Red and blue circles show synapses with coupled (θd-spike = θAP) and compartmentalized (θd-spike < θAP) thresholds, respectively. Symbol size represents θd-spikeAP threshold ratio, and the + symbol indicates the single case in which the d-spike never propagated into the trunk, even with a stimulation of 40 nS. G, Optimal ddend/dtrunk values for threshold separation as a function of stimulation distance from the branch point. Red area depicts coupled synapses, blue gradient shows different degrees of thresholds separation, with darker shade indicating greater compartmentalization. The black dot corresponds to data shown in F. H, Black line, Average level of branch compartmentalization for the compartmentalized branches as a function of the synaptic distance from the branch point. Percentages, Amount of compartmentalized branches; dotted lines, average ± SD level of branch compartmentalization.
Figure 2.
Figure 2.
Experimental validation of the computational model. A, Experimental (noisy lines) and simulated (smooth lines) voltage traces recorded in the soma at different stimulation intensities: subthreshold EPSP (blue), θd-spike (gray), and θAP (black). B, Simulations showing the effect of hyperpolarization on a branch with coupled d-spike and AP thresholds; the morphological parameters of the model were measured from the branch used for the voltage trace experiment in A. Green and red marks on the x-axis represent membrane resting potential and experimental holding potential, respectively. C, Low-magnification (left) and high-magnification (right) of a representative oblique dendrite, with numbered labels identifying two-photon glutamate uncaging locations. Colored circles within location 1 show the four spines used for two-photon glutamate uncaging at that location. D, Individual gluEPSPs for the four spines (colored circles in C), activated 210 ms apart from each other, at d-spike threshold. Calibration: 50 ms, 0.5 mV. E, Arithmetic sum of the individual responses at d-spike threshold (same calibration in D); this sum equals the “threshold input” in F. F, Computed threshold input, defined as the equivalent peak somatic depolarization evoked at θd-spike. This parameter was calculated by summing the voltage peaks recorded from a number of individually stimulated synapses that, when activated together, would trigger a d-spike (D, E). These values were collected for different branches (colors) as a function of the stimulation distance from the branch point and fitted with exponential functions. G, Simulation of the experimental design from C, using the branch-point morphological parameters measured from 171 oblique dendrites. Lines represent exponential fittings of peak somatic depolarization during a d-spike, for branches stemming from the main trunk at a random distance between 0 and 100 μm from the soma. H, Exponential fitting parameters of experimental (blue) and modeling (red) data; error bars represent 95% confidence intervals of best-fitting values. Note that the bottom part of the ordinate axis (from −0.3 to −1.1) has a separate compressed scale to accommodate three confidence interval outliers.
Figure 3.
Figure 3.
Potential functional effects of bifurcation morphological dynamics. A, Top, Regular, typical morphology. Middle, In the husky morphology, the tapering surface is redistributed to increase the dendritic diameter from the branch point up to the synaptic location. Bottom, In the lanky morphology, the tapering surface is used to increase the distance of the synaptic input from the branch point. In all cases, red indicates the membrane portion without a tapering surface; gray and black symbols schematically show the location of the synaptic input on the dendrite and of the recording electrode in the trunk, respectively. B, Top, Branch-point exocytosis of transferrin receptor (TfR)-pHluorin after glycine-induced LTP in rat CA1 pyramidal neuron. TfR-pHluorin fluorescence was imaged before or 20 min after glycine stimulation. The bar (10 μm) is a pseudocolor intensity scale. Image reproduced with permission from Park et al. (2006). Orange and red lines highlight the contour of the branch-point tapering region before (left, no taper) and after (right, regular) LTP induction. Middle, Imaging of CA1 pyramidal neuron dendrites during spontaneous activation at time 0 (left) and 60 (right) min. Green and orange lines show a regular-to-husky transformation. Scale bar, 1 μm. Bottom, Response of a rat CA1 pyramidal neuron in a cell culture to a pulse of glutamate applied from a micropipette. Orange and blue lines depict the transformation from regular to lanky. Scale bar, 5 μm. Middle and bottom images are snapshots from the videos described by Smith and Jahr (1992), courtesy of Dr. S. Smith (Stanford University, Palo Alto, CA). C, Trunk voltage traces for four tapering shapes (without tapering membrane in red, regular in orange, husky in green, lanky in blue). Insets in middle plots represent trunk dV/dt in the absence or presence of a local spike. Symbols on top represent specific synaptic strengths, indicated in D. Arrows and asterisks indicate d-spike and AP, respectively. D, Trunk peak voltage as a function of synaptic peak conductance shows the compartmentalization associated with husky (H), regular (R), and lanky (L) branch points. E, Effect of changing branch-point morphology on θd-spike and θAP. Black arrows show husky-to-regular changes; red arrows depict regular-to-lanky effects. For the simulations of the branch point illustrated in this figure, the synaptic input was at 38 μm from the branch point for the regular and husky configurations and at 42.51 ± 5.25 μm (mean ± SD) for the lanky case.
Figure 4.
Figure 4.
Functional effects of IKA relative to variation in branch-point morphology. A, Top, Fraction of compartmentalized branches as a function of IKA activation in the regular case, with synapses distributed at 50 μm from the branch point (BP). The orange line indicates the compartmentalized fraction with baseline IKA activation. The horizontal green and blue lines mark the compartmentalized fraction in the same conditions for husky (H) and lanky (L) configurations, respectively. The vertical green and blue lines denote the levels of IKA activation that yield the same compartmentalization in the regular (R) case. Bottom, Average amount of compartmentalization for uncoupled branches (θd-spikeAP < 1) as a function of IKA. The green and blue lines indicate the level of IKA activation in the regular case that yields the same compartmentalization amount as baseline IKA in the husky and lanky configurations, respectively, as in A. Dotted lines denote SD of compartmentalization amounts. B, Same as A, but synaptic distance from the branch point in the regular case was 38 μm instead of 50 μm.
Figure 5.
Figure 5.
Temporal consequences of branch-point morphology variation. A, AP delay onset for husky (H, green), regular (R, orange), and lanky (L, blue) dendrites (+ symbols are averages; ***p < 10−5, 1-tailed paired t test). B, Effects of ddend/dtrunk diameter ratio on onset and jitter (inset) in regular branches. AP onset jitter was calculated as the AP onset SD over a sliding window of 20 branches. Line in the main figure is a power fit. C, Power relationships between d-spike threshold and AP onset in regular branches. D, Logarithmic relationship between AP threshold and onset in regular branches. BP, Branch point.
Figure 6.
Figure 6.
Effects of branch-point morphology on a realistic neuronal model. A, Reconstructed soma and dendritic arborizations of a hippocampal CA1 pyramidal neuron (Ferrante et al., 2008; ModelDB accession number 119283). Inset shows magnification of the branch-point area and the oblique dendrite selected for all simulations. The branch-point morphological parameters were set to the averages of the experimentally recorded values (Fig. 1B). B, Stimulation threshold (θ) to generate a local dendritic spike (d-spike, gray line) or a somatic AP (black line) as a function of the distance of the input from the branch point (BP; compare with Fig. 1C). Inset depicts θd-spikeAP threshold ratio as a function of the distance of the input from the branch point (compare with Fig. 1H). C, Exponential decay of the computed threshold input as a function of the distance of the synaptic input from the branch point (compare with Fig. 2C,D). Inset, Gray voltage trace shows the d-spike for the specific computed threshold input; AP (black line) and voltage signatures for the same synaptic cluster are also shown (compare with Fig. 2A). D, Somatic peak voltage as a function of synaptic peak conductance shows the compartmentalization associated with husky (H, green), regular (R, orange), and lanky (L, green) branch points (compare with Fig. 3D). Inset, AP onset time for the three morphological configurations: husky, regular, and lanky. E, Symbol size represents θd-spikeAP threshold ratio as a function of ddend and synaptic distance from the branch point for the husky, regular, and lanky branch shapes (compare with Figs. 1F, 7A). F, Amount of compartmentalization (θd-spikeAP < 1) as a function of IKA activation. The orange line indicates the regular branch compartmentalization with baseline IKA activation. The green and blue lines mark the branch compartmentalization corresponding to the husky and lanky configurations, respectively (compare with Fig. 4C,D).
Figure 7.
Figure 7.
Functional consequences of changing branch-point morphology. A, Top, Threshold separation (θd-spike, gray; θAP, black), as a function of the oblique branch diameter and of the distance of the synaptic input from the branch point; the white dotted lines indicate the threshold change with branch-point morphology. Bottom, Representative parameters for a regular branch (R, orange dot) and the corresponding husky (H, green dot) and lanky (L, blue dot) branches obtained by reconfiguring the fringe taper membrane. The vertical projections (orange, blue, and green lines) indicate the corresponding threshold separation effects. B, Top (red), Amount of elongation obtained by reconfiguring the fringe membrane from regular to lanky as a function of the taper surface area at the first, median, and third quartiles of oblique branch diameter. Bottom (blue), Amount of thickening obtained by reconfiguring the fringe membrane from regular to husky as a function of the branch-point surface for a three stimulation distances from the bifurcation. Gray and black dots and dotted lines denote the effects for the median (Q2) and third (Q3) quartiles of the measured surface distribution, respectively.

References

    1. Andrasfalvy BK, Magee JC. Distance-dependent increase in AMPA receptor number in the dendrites of adult hippocampal CA1 pyramidal neurons. J Neurosci. 2001;21:9151–9159. - PMC - PubMed
    1. Bourne JN, Harris KM. Balancing structure and function at hippocampal dendritic spines. Annu Rev Neurosci. 2008;31:47–67. - PMC - PubMed
    1. Cai X, Liang CW, Muralidharan S, Kao JP, Tang CM, Thompson SM. Unique roles of SK and Kv4.2 potassium channels in dendritic integration. Neuron. 2004;44:351–364. - PubMed
    1. Canepari M, Djurisic M, Zecevic D. Dendritic signals from rat hippocampal CA1 pyramidal neurons during coincident pre- and post-synaptic activity: a combined voltage- and calcium-imaging study. J Physiol. 2007;580:463–484. - PMC - PubMed
    1. Caporale N, Dan Y. Spike timing-dependent plasticity: a Hebbian learning rule. Annu Rev Neurosci. 2008;31:25–46. - PubMed

Publication types