. 2013 Jan 30;33(5):2217-28.
doi: 10.1523/JNEUROSCI.2779-12.2013.

The location of feedback-related activity in the midcingulate cortex is predicted by local morphology

Affiliations

The location of feedback-related activity in the midcingulate cortex is predicted by local morphology

Céline Amiez et al. J Neurosci. .

Abstract

Information processing in the medial frontal cortex is often said to be modulated in pathological conditions or by individual traits. This has been observed in neuroimaging and event-related potential studies centered in particular on midcingulate cortex (MCC) functions. This region of the brain is characterized by considerable intersubject morphological variability. Whereas in a subset of hemispheres only a single cingulate sulcus (cgs) is present, a majority of hemispheres exhibit an additional sulcus referred to as the paracingulate sulcus (pcgs). The present functional magnetic resonance imaging study defined the relationship between the local morphology of the cingulate/paracingulate sulcal complex and feedback-related activity. Human subjects performed a trial-and-error learning task in which they had to discover which one of a set of abstract stimuli was the best option. Feedback was provided by means of fruit juice, as in studies with monkeys. A subject-by-subject analysis revealed that the feedback-related activity during exploration was systematically located in the cgs when no pcgs was observed, but in the pcgs when the latter sulcus was present. The activations had the same functional signature when located in either the cgs or in the pcgs, confirming that both regions were homologues. Together, the results show that the location of feedback-related MCC activity can be predicted from morphological features of the cingulate/paracingulate complex.


Figures
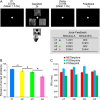
Figure 1.
Figure 1.
Protocol and behavioral results. A, The subjects had to find by trial and error which one of the three stimuli led to the highest juice feedback value (stimulus A) by selecting one stimulus through a press on the corresponding mouse button. Note that the same stimuli appeared on successive trials until the problem was completed (i.e., after discovery and repetition of the correct response). Stimuli B and C refer to incorrect stimuli. There were four conditions, presented pseudo-randomly, and indicated by the color of the fixation cross throughout the entire trial (table inset). B, The percentage of correctly solved problems (i.e., with no repetition of erroneous choice in exploratory periods and without erroneous choice in the exploitatory periods) for each condition. C, Response times (RTs) for the 4 conditions and for each trial type (NEGexplore, incorrect during exploration; POSexplore, first correct trial; POSexploit, correct during exploitation) between the 4 conditions and the 3 trial types. Error bars represent SEM. *p < 0.05, post hoc Fisher test.
Figure 2.
Figure 2.
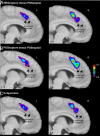
fMRI group results in the MCC. A, Difference in the feedback-related BOLD signal change observed in the MCC between the negative exploratory and the positive exploitatory trials (NEGexplore minus POSexploit). B, Difference in the feedback-related BOLD signal change observed in the MCC between the first correct exploratory and the positive exploitatory trials (POSexplore minus POSexploit). C, Results of conjunction between these two comparisons. Functional maps are represented on sagittal sections in the left (L) and right (R) hemispheres of the average anatomical brain from 15 subjects, at the mediolateral levels described by the x-values. The color scale represents the range of t values.
Figure 3.
Figure 3.
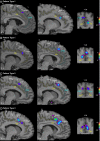
Example patterns of anatomo-functional organization of the MCC observed in typical individual subjects. The feedback-related activity is always located in the cgs when no pcgs is observed, or in pcgs otherwise. The examples illustrate subjects of Type 1 in which a pcgs is observed in the left hemisphere but not in the right hemisphere (A, S1) or in which a pcgs is observed in the right hemisphere but not in the left hemisphere (B, S2), a subject of Type 2 in which a pcgs is observed in both hemispheres (C, S4), and a subject of Type 3 where no pcgs is observed (D, S6). The activation foci are presented on sagittal sections on the left and right hemispheres (at the mediolateral levels x = −4 (A), −8 (B), −8 (C), −10 (D) for the left hemisphere and x = 12 (A), 6 (B), 10 (C), 8 (D) for the right hemisphere), as well as on coronal section [at anteroposterior levels y = 26 (A), 28 (B), 22 (C), 28 (D)]. The cgs and pcgs are color-coded in yellow and blue, respectively. L, Left hemisphere; right, right hemisphere; cs, central sulcus. The color scale represents the range of t values.
Figure 4.
Figure 4.
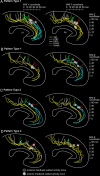
A–D, Anatomo-functional organization of the MCC in all subjects displaying a morphology of Type 1 (A, B), Type 2 (C), and Type 3 (D). Each dot corresponds to the location of the feedback-related activity observed during exploration periods of each subject. Each number corresponds to the subject's name referred to in Tables 1 and 2. The light and dark gray dots indicate the feedback-related activity observed in the aMCC and pMCC, respectively. As it can be observed, all subjects displayed feedback-related activity in the aMCC at the intersection between cgs or pcgs and vpcgs. In 6 subjects, an additional activation focus was detected in the pMCC at the intersection between cgs and prpacs. Abbreviations as in Figure 3. LH, Left hemisphere; RH, right hemisphere.
Figure 5.
Figure 5.
Functional signature of feedback-related activation. Left, For a typical subject (S1), example ROIs in the MCC in the cgs (A), the pcgs (B), and the cgs for subjects, as S1, exhibiting a pcgs (C), from which the percentage of BOLD signal change was extracted. Middle and right columns, Average percentage of BOLD signal change at feedback within the aMCC focus in the right (middle) and left (right) hemisphere. The volumes of juice obtained in NEGexplore, POSexplore, and POSexploit trials are indicated below the abscissa. Error bars represent SEM.
Figure 6.
Figure 6.
A, Left, Dispersion of the feedback-related activation foci in the aMCC based on individual subject analysis in hemispheres with (in yellow) and without (in blue) a paracingulate sulcus. Each dot corresponds to the location of the highest t value observed in each subject during the analysis of feedback during exploratory behavior in aMCC in both hemispheres. Note that foci from both right and left are projected onto one hemisphere. Right, Subgroup analysis for pooled left and right hemispheres without a pcgs, with a pcgs, and for all hemispheres. Feedback-related activation foci of subgroups with and without a pcgs as well as with all hemispheres are presented on the anatomical averages of left and right hemispheres without a pcgs, with a pcgs, and with all hemispheres, respectively (Table 2). B, Summary of the organization of feedback-related activation foci in the aMCC of the human brain. The location of feedback-related activation depends on whether a pcgs is (case 2) or is not present (Case 1). Together with the cytoarchitectonic subdivisions described by Vogt et al., 1995 (see insets), this suggests that feedback related activity might be located in area 32′. Abbreviations as in Figure 3.

References

    1. Amiez C, Petrides M. Feedback valuation processing within the prefrontal cortex. In: Dreher JC, Tremblay L, editors. Handbook of reward and decision making. New York: Elsevier; 2009. pp. 213–228.
    1. Amiez C, Petrides M. Neuroimaging evidence of the anatomo-functional organization of the human cingulate motor areas. Cereb Cortex. 2012 doi: 10.1093/cercor/bhs329. Advance online publication. Retrieved Nov. 6, 2012. - DOI - PubMed
    1. Amiez C, Joseph JP, Procyk E. Anterior cingulate error-related activity is modulated by predicted reward. Eur J Neurosci. 2005;21:3447–3452. - PMC - PubMed
    1. Amiez C, Kostopoulos P, Champod AS, Petrides M. Local morphology predicts functional organization of the dorsal premotor region in the human brain. J Neurosci. 2006;26:2724–2731. - PMC - PubMed
    1. Amiez C, Kostopoulos P, Champod AS, Collins DL, Doyon J, Del Maestro R, Petrides M. Preoperative functional magnetic resonance imaging assessment of higher-order cognitive function in patients undergoing surgery for brain tumors. J Neurosurg. 2008;108:258–268. - PubMed

Publication types

LinkOut - more resources