

Gestational protein restriction increases angiotensin II production in rat lung
- PMID: 23365412
- PMCID: PMC4013854
- DOI: 10.1095/biolreprod.112.103770
Gestational protein restriction increases angiotensin II production in rat lung
Abstract
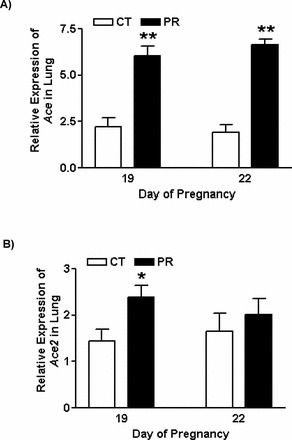
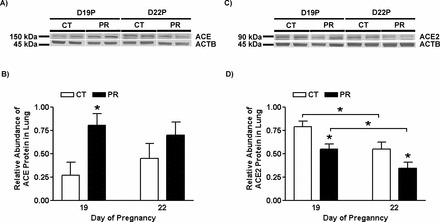
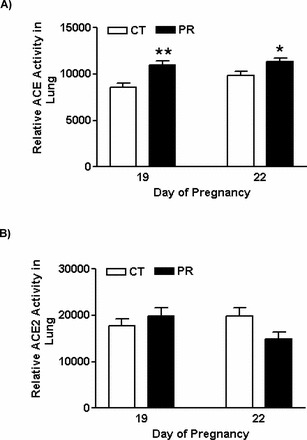
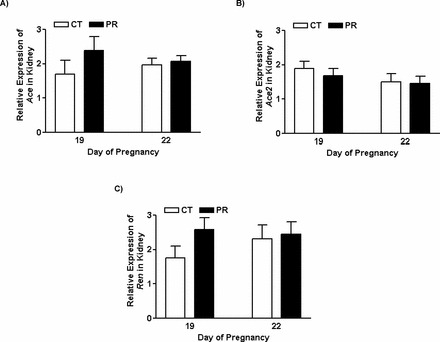
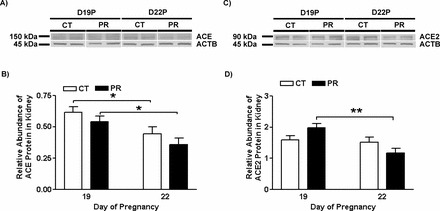
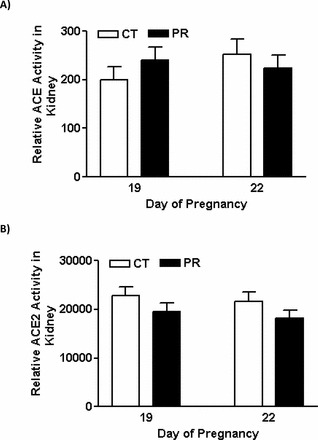
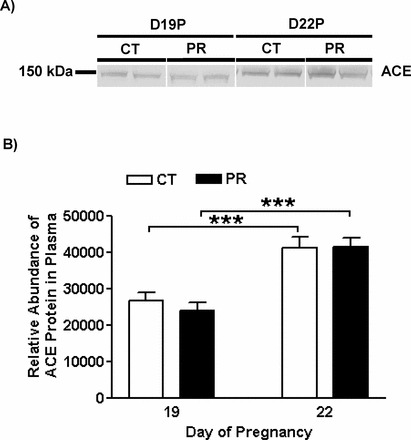
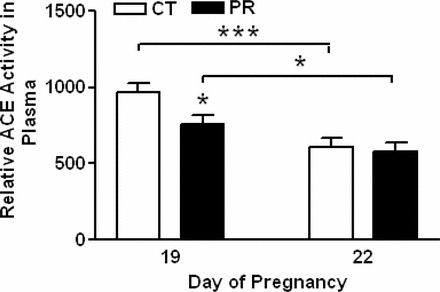
Gestational protein restriction (PR) alters the renin-angiotensin system in uterine arteries and placentas and elevates plasma levels of angiotensin II in pregnant rats. To date, how PR increases maternal plasma levels of angiotensin II remains unknown. In this study, we hypothesize that the expression and/or the activity of angiotensin I converting enzyme (peptidyl-dipeptidase A) 1 (ACE) in lungs, but not kidneys and blood, largely contribute to elevated plasma angiotensin II levels in pregnant rats subject to gestational PR. Time-scheduled pregnant Sprague-Dawley rats were fed a normal or low-protein diet from Day 3 of pregnancy until euthanized at Day 19 or 22. Expressions of Ace and Ace2 (angiotens in I converting enzyme [peptidyl-dipeptidase A] 2) in lungs and kidneys from pregnant rats by quantitative real-time PCR and Western blotting, and the activities of these proteins in lungs, kidneys, and plasma, were measured. The mRNA levels of Ace and Ace2 in lungs were elevated by PR at both Days 19 and 22 of pregnancy. The abundance of ACE protein in lungs was increased, but ACE2 protein was decreased, by PR. The activities of ACE, but not ACE2, in lungs were increased by PR. PR did not change expressions of Ace and Ace2, the activities of both ACE and ACE2 in kidneys, and the abundance and activity of plasma ACE. These findings suggest that maternal lungs contribute to the elevated plasma levels of angiotensin II by increasing both the expression and the activity of ACE in response to gestational PR.
Figures
Similar articles
-
A Low-Protein Diet Enhances Angiotensin II Production in the Lung of Pregnant Rats but not Nonpregnant Rats.J Pregnancy. 2016;2016:4293431. doi: 10.1155/2016/4293431. Epub 2016 Apr 19. J Pregnancy. 2016. PMID: 27195150 Free PMC article.
-
Maternal protein restriction reduces expression of angiotensin I-converting enzyme 2 in rat placental labyrinth zone in late pregnancy.Biol Reprod. 2012 Feb 9;86(2):31. doi: 10.1095/biolreprod.111.094607. Print 2012 Feb. Biol Reprod. 2012. PMID: 22011389 Free PMC article.
-
Protein restriction to pregnant rats increases the plasma levels of angiotensin II and expression of angiotensin II receptors in uterine arteries.Biol Reprod. 2012 Mar 19;86(3):68. doi: 10.1095/biolreprod.111.095844. Print 2012 Mar. Biol Reprod. 2012. PMID: 22088913 Free PMC article.
-
Angiotensin-converting enzyme 2: possible role in hypertension and kidney disease.Curr Hypertens Rep. 2008 Feb;10(1):70-7. doi: 10.1007/s11906-008-0014-1. Curr Hypertens Rep. 2008. PMID: 18367030 Free PMC article. Review.
-
Not just angiotensinases: new roles for the angiotensin-converting enzymes.Cell Mol Life Sci. 2010 Jan;67(1):89-98. doi: 10.1007/s00018-009-0152-x. Epub 2009 Sep 10. Cell Mol Life Sci. 2010. PMID: 19763395 Free PMC article. Review.
Cited by
-
An open-label, dose-escalation study to evaluate the safety, tolerability, pharmacokinetics, and pharmacodynamics of single doses of GSK2586881 in participants with pulmonary arterial hypertension.Pulm Circ. 2022 Jan 20;12(1):e12024. doi: 10.1002/pul2.12024. eCollection 2022 Jan. Pulm Circ. 2022. PMID: 35506108 Free PMC article.
-
Appetite regulation is independent of the changes in ghrelin levels in pregnant rats fed low-protein diet.Physiol Rep. 2015 Apr;3(4):e12368. doi: 10.14814/phy2.12368. Physiol Rep. 2015. PMID: 25907788 Free PMC article.
-
A Low-Protein Diet Enhances Angiotensin II Production in the Lung of Pregnant Rats but not Nonpregnant Rats.J Pregnancy. 2016;2016:4293431. doi: 10.1155/2016/4293431. Epub 2016 Apr 19. J Pregnancy. 2016. PMID: 27195150 Free PMC article.
References
Publication types
MeSH terms
Substances
Grants and funding
LinkOut - more resources
Full Text Sources
Other Literature Sources
Research Materials
Miscellaneous
