. 2013 Apr;87(7):3885-902.
doi: 10.1128/JVI.02520-12. Epub 2013 Jan 30.

Release of severe acute respiratory syndrome coronavirus nuclear import block enhances host transcription in human lung cells

Affiliations

Release of severe acute respiratory syndrome coronavirus nuclear import block enhances host transcription in human lung cells

Amy C Sims et al. J Virol. 2013 Apr.

Abstract

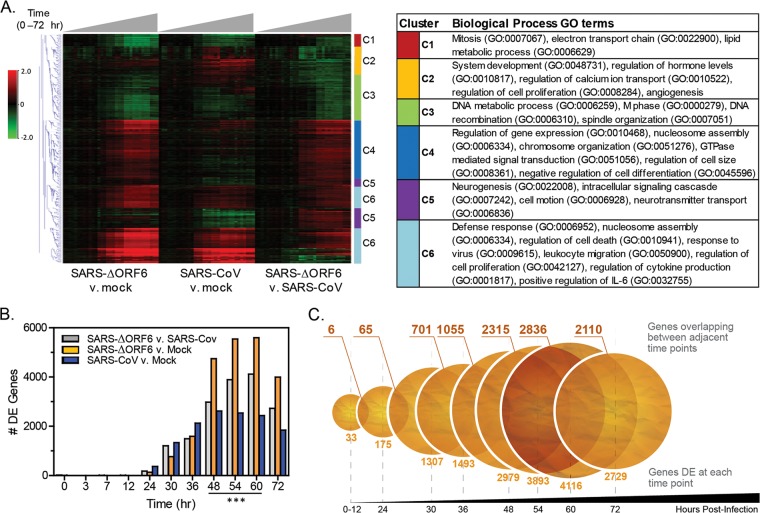
The severe acute respiratory syndrome coronavirus accessory protein ORF6 antagonizes interferon signaling by blocking karyopherin-mediated nuclear import processes. Viral nuclear import antagonists, expressed by several highly pathogenic RNA viruses, likely mediate pleiotropic effects on host gene expression, presumably interfering with transcription factors, cytokines, hormones, and/or signaling cascades that occur in response to infection. By bioinformatic and systems biology approaches, we evaluated the impact of nuclear import antagonism on host expression networks by using human lung epithelial cells infected with either wild-type virus or a mutant that does not express ORF6 protein. Microarray analysis revealed significant changes in differential gene expression, with approximately twice as many upregulated genes in the mutant virus samples by 48 h postinfection, despite identical viral titers. Our data demonstrated that ORF6 protein expression attenuates the activity of numerous karyopherin-dependent host transcription factors (VDR, CREB1, SMAD4, p53, EpasI, and Oct3/4) that are critical for establishing antiviral responses and regulating key host responses during virus infection. Results were confirmed by proteomic and chromatin immunoprecipitation assay analyses and in parallel microarray studies using infected primary human airway epithelial cell cultures. The data strongly support the hypothesis that viral antagonists of nuclear import actively manipulate host responses in specific hierarchical patterns, contributing to the viral pathogenic potential in vivo. Importantly, these studies and modeling approaches not only provide templates for evaluating virus antagonism of nuclear import processes but also can reveal candidate cellular genes and pathways that may significantly influence disease outcomes following severe acute respiratory syndrome coronavirus infection in vivo.


Figures

Fig 1
Fig 1
ORF6 function and replication kinetics in Calu3 2B4 cells. (A) Function of the interferon antagonist ORF6 protein in SARS-CoV infection. The diagram is a schematic representation of the block of nuclear translocation of the karyopherins induced by the SARS-CoV interferon antagonist, ORF6 protein. The ORF6 protein sequesters karyopherin α2 and β1 on the cytoplasmic face of the endoplasmic reticulum in infected cells, preventing nuclear translocation of many factors, including transcription factors (TF) that require karyopherins for nuclear entry, preventing transcription of downstream genes. Kα2, karyopherin α2; Kβ1, karyopherin β1; ER, endoplasmic reticulum. (B and C) Triplicate wells of Calu3 2B4 human lung cells were infected with either icSARS-CoV or icSARS-CoV ΔORF6 (MOI of 5). Medium from each well was collected and analyzed by plaque assay for viral growth kinetics in Vero E6 cells, while the cells were harvested for either total RNA for transcriptomic or total protein for proteomic analysis. In panel B, data are shown as the average titer obtained at each time point (6 samples per time point) and were plotted as the PFU/ml. Peak titers for both viruses were detected at 36 h postinfection, and no significant differences in viral titers were detected at any time point. Error bars are the standard deviations of the replicate wells. In panel C, total RNA from infected samples was analyzed by real-time PCR to determine the levels of viral mRNA species (genomic RNA, spike subgenomic RNA, and envelope subgenomic RNA) produced over the time course of infection. No significant differences were detected at any time postinfection at a high MOI in human lung epithelial cells. Symbols in panel B: closed circles with unbroken line, icSARS-CoV; closed triangles with dashed line, icSARS-CoV ΔORF6. Color coding for panel C: green bars, icSARS-CoV genomic RNA; orange, icSARS-CoV spike subgenomic RNA; blue bars, icSARS-CoV envelope subgenomic RNA; white bars, icSARS-CoV ΔORF6 genomic RNA; black bars, icSARS-CoV ΔORF6 spike subgenomic RNA; yellow bars, icSARS-CoV ΔORF6 envelope subgenomic RNA. (D and E) Comparison of viral structural protein (M membrane in panel D) and viral accessory protein (ORF6 in panel E) abundance as determined by global proteomics analysis. Values for proteins represent mean protein abundance levels as measured by mass spectrometry. By 24 h postinfection, M protein was detected for each virus, and the amounts increased through 54 h postinfection. The ORF6 protein was detectable exclusively in the icSARS-CoV-infected samples and also increased in expression through 54 h postinfection. Error bars represent standard errors of the means based on mean protein abundance values derived from mass spectrometry readings of three independent samples at each time point. Symbols and abbreviations in panels D and E: blue lines, icSARS-CoV-infected cells; red lines, icSARS-CoV ΔORF6-infected cells; black lines, mock-infected cells.
Fig 2
Fig 2
Differentially expressed (DE) genes in icSARS-CoV-infected versus icSARS-CoV ΔORF6-infected Calu3 2B4 cells. (A) Heat map and table of gene ontology categories. The heat map represents unsupervised hierarchical clustering of the 6,947 differentially expressed genes (P < 0.05; 2-fold change) between icSARS-CoV and icSARS-CoV ΔORF6 infection of Calu3 2B4 cells, from 0 to 72 h postinfection. Values are the fold change (log2) compared to time-matched mock infection or icSARS-CoV infection as indicated. Colored bars represent gene tree subclusters. On the right, functional enrichment of significant (P < 0.05) biological process Gene Ontology categories for gene tree clusters C1 to C6. Genes within each cluster are indicated on the far right of the heat map. (B) Bar graph of differentially expressed genes (P < 0.05, |1.5-fold change| [log2]) for time-matched comparisons in icSARS-CoV versus mock, icSARS-CoV ΔORF6 versus mock, or icSARS-CoV ΔORF6 versus icSARS-CoV at 0 to 72 h postinfection. ***, from 48 to 72 h postinfection, nearly twice the number of genes were differentially expressed in icSARS-CoV ΔORF6-infected versus icSARS-CoV-infected cells (P < 0.001), indicating the ORF6-dependent nuclear import block has been released. (C) Circle diagram of differentially expressed genes between icSARS-CoV ΔORF6 and icSARS-CoV across the time course.
Fig 3
Fig 3
Identification of transcription factor hubs directly affected by removal of ORF6-dependent nuclear import block. The schematic shows the network for significantly overconnected transcription factors (P < 0.05) whose nuclear transport is prevented by ORF6 in wild-type SARS-CoV infection. White circles represent overconnected transcriptional hubs; dark gray circles represent target nodes whose relative expression was lower with icSARS-CoV than with icSARS-ΔORF6; light gray circles represent karyopherins; gray lines represent edge connections between hubs, nodes, and karyopherins; heavy black lines represent direct edge connections between karyopherins and transcriptional factor hubs. The enlarged inset includes genes in the VDR and CREB1 networks for which transcriptional patterns were confirmed by HAE transcriptomic and Calu3 2B4 proteomic data (see Fig. 5 and 6, respectively).
Fig 4
Fig 4
Differential gene expression quantitation for transcription factor networks. Average gene expression for icSARS-ΔORF6 (dotted lines) and icSARS-CoV (solid lines) for target gene nodes (mRNA microarray values for genes regulated by transcription factors) are shown. For each network, a group of genes is regulated by a specific transcription factor. (A) Karyopherin target networks (VDR, CREB1, Oct3/4, p53, EpasI, and SMAD4) from cluster C4 (Fig. 2). (B) Representative nonkaryopherin target network. Values are the average fold change (log2) ± the standard error compared to time-matched mock infection for 0 to 72 h postinfection. Significant differences in gene expression between icSARS-CoV and icSARS-ΔORF6 at each time point were calculated by a two-way analysis of variance with Bonferroni multiple testing correction and are indicated by the following lowercase letters: a, P < 0.05; b, P < 0.01; c, P < 0.0001. CTNNB1, beta catenin 1; AR, androgen receptor.
Fig 5
Fig 5
HAE independent confirmation studies. HAE cells were infected with wild-type or SARS-CoV ΔORF6 (MOI of 2) and harvested at 24, 48, and 72 h postinfection for microarray analysis. (A) Apical wash samples were collected in triplicate at the indicated times and assessed by plaque assay in Vero E6 cells. Data are the average titers obtained at each time point (3 samples per time point) and were plotted as PFU/ml. icSARS-CoV titers (white bars) increased through 48 h postinfection and then decreased slightly at 72 h postinfection. In contrast, replication titers for icSARS-CoV ΔORF6 titers (gray bars) increased over the entire course of the infection. At a slightly reduced MOI (Calu3 2B4 cell MOI of 5, versus HAE MOI of 2), icSARS-CoV ΔORF6 demonstrated slower growth kinetics until later in infection in primary cells. (B) Karyopherin-mediated VDR and CREB1 transcription factor networks were significantly (P < 0.05) enriched for both Calu3 2B4 and HAE data sets. Light gray circles, gene nodes from the Calu3 2B4 experiment; dark gray circles, gene nodes from the HAE experiment; black circles, gene nodes that overlapped in the two experiments. (C) Comparison of gene expression in Calu3 2B4 cells (closed circles) and HAE cells (open squares) postinfection for target gene nodes downstream, VDR and CREB1. Values are the fold change (log2) for icSARS-ΔORF6 versus icSARS-CoV. Calu3 2B4 cell results represent the average expression level ± the standard error for 3 replicates on individual arrays. HAE cell results represent the average expression for 2 replicates pooled on arrays. Scl19a2, thiamine transporter gene; Scl2a6, glucose transporter gene; Abtb5, POK family transcription factor.
Fig 6
Fig 6
Proteomic validation studies. The graphs show comparisons of individual gene RNA expression (left panels) and protein abundance (right panels) as determined by microarray and global proteomics analysis for EDC3 and AP2M1. Values for transcripts reflect the log2-fold change in expression over mock infection. For proteins, values represent mean protein abundance levels as measured by mass spectrometry. Error bars represent standard errors of the means based on mean protein abundance values derived from mass spectrometry readings of three independent samples at each time point. EDC3, enhancer of mRNA-decapping protein 3; AP3M1, adaptor-related protein complex 3. Solid gray lines, mock-infected samples; dotted lines, ΔORF6-infected samples; solid black lines, wild-type-infected samples. P values were determined with the Student t test as indicated. *, P < 0.05; **, P < 0.01; ***, P < 0.001.
Fig 7
Fig 7
Verification of CREB1 and VDR downstream target genes in icSARS-CoV- and icSARS-CoV ΔORF6-infected Calu3 2B4 cells. Calu3 2B4 cells were infected with icSARS-CoV or icSARS-CoV ΔORF6, or mock infected, and then harvested for ChIP at 0, 24, and 48 h postinfection. ChIP was performed with anti-CREB (MMP19, CDKN1A), anti-VDR (MCL-1), and anti-IgG antibodies (negative control) on each set of samples, and selected target genes whose expression was regulated by either CREB1 or VDR, as identified by microarray analysis, were verified by quantitative real-time PCR. The relative fold enrichment levels for Mcl-1 (a), CDKN1A (b), and MMP19 (c) for icSARS-CoV- or icSARS-CoV ΔORF6-infected Calu3 2B4 cells over the 48-h time course are shown. The CT values were analyzed by using the standard curve method, and each sample was normalized to the appropriate IgG sample and to the corresponding time-matched mock infection sample. Data are the means ± standard errors of the means for triplicate experiments. *, P < 0.05; **, P < 0.01 (Student's t test). Gray bars, icSARS-CoV ΔORF6; black bars, icSARS-CoV.
Fig 8
Fig 8
icSARS-CoV ΔORF6 is attenuated at low MOIs and in B6 mice. (A) Gene expression for antiviral pathways. Hierarchical clustering by Euclidean distance of genes from two enriched biological process GO categories from Fig. 2B (cluster C6), the “defense response” (GO:0006952) and “response to virus” (GO:0009615). A total of 71 out of 96 genes in these pathways were significantly upregulated in icSARS-CoV ΔORF6 compared to icSARS-CoV between 0 and 72 h postinfection in Calu3 2B4 cells and are presented in the heat map. Values are the fold change (log2) in icSARS-CoV ΔORF6 versus icSARS-CoV at each time point. Red, green, and black represent upregulated, downregulated, and unchanged genes, respectively. (B) Low-MOI Calu3 2B4 cell infection. Calu3 2B4 human lung cells were infected with either icSARS-CoV or icSARS-CoV ΔORF6 (MOI of 0.01). Medium from each well was collected and analyzed by plaque assay for viral growth kinetics in Vero E6 cells. Data are the average titer obtained at each time point (3 samples per time point) and were plotted as PFU/ml. Peak titers for icSARS-CoV were detected at 72 h postinfection, while titers for icSARS-CoV ΔORF6 peaked at 96 h postinfection, suggesting that the mutant was attenuated at a low MOI over the course of the infection. Closed circles and unbroken line, icSARS-CoV; closed triangles and dashed line, icSARS-CoV ΔORF6. (C and D) Weight loss (C) and titer data (D) for 20-week-old B6 mice (n = 5) infected intranasally with 105 PFU of virus. Weight loss was assessed each day postinfection through day 7, and titers were assessed at the indicated times postinfection. Mice infected with icSARS-CoV mouse-adapted virus steadily lost weight over the course of the infection; in contrast, mice infected with the icSARS-CoV ΔORF6 mouse-adapted virus lost weight until day 4 postinfection, when they began to recover from infection and to gain weight. Mock-infected mice had no appreciable weight loss at any time postinfection. Symbols in panel C: closed circles and solid line, icSARS-CoV mouse-adapted virus; open triagles and dotted line, icSARS-CoV ΔORF6 mouse-adapted virus; open circles and solid line, mock infection. No significant differences in titers were detected at days 1, 2, or 7 days postinfection. Open circles, mock infection; gray triangles, icSARS-CoV ΔORF6 infection; filled circles, icSARS-CoV infection. Error bars indicate standard deviations from the means. Asterisks indicates a P value of <0.01 for icSARS-CoV mouse-adapted virus versus icSARS-CoV ΔORF6 mouse-adapted virus. Box colors in panel D: black, icSARS-CoV; gray, icSARS-CoV ΔORF6.

References

    1. Drosten C, Gunther S, Preiser W, van der Werf S, Brodt HR, Becker S, Rabenau H, Panning M, Kolesnikova L, Fouchier RA, Berger A, Burguiere AM, Cinatl J, Eickmann M, Escriou N, Grywna K, Kramme S, Manuguerra JC, Muller S, Rickerts V, Sturmer M, Vieth S, Klenk HD, Osterhaus AD, Schmitz H, Doerr HW. 2003. Identification of a novel coronavirus in patients with severe acute respiratory syndrome. N. Engl. J. Med. 348:1967–1976 - PubMed
    1. Ksiazek TG, Erdman D, Goldsmith CS, Zaki SR, Peret T, Emery S, Tong S, Urbani C, Comer JA, Lim W, Rollin PE, Dowell SF, Ling AE, Humphrey CD, Shieh WJ, Guarner J, Paddock CD, Rota P, Fields B, DeRisi J, Yang JY, Cox N, Hughes JM, LeDuc JW, Bellini WJ, Anderson LJ. 2003. A novel coronavirus associated with severe acute respiratory syndrome. N. Engl. J. Med. 348:1953–1966 - PubMed
    1. Guan Y, Zheng BJ, He YQ, Liu XL, Zhuang ZX, Cheung CL, Luo SW, Li PH, Zhang LJ, Guan YJ, Butt KM, Wong KL, Chan KW, Lim W, Shortridge KF, Yuen KY, Peiris JS, Poon LL. 2003. Isolation and characterization of viruses related to the SARS coronavirus from animals in southern China. Science 302:276–278 - PubMed
    1. Lau SK, Woo PC, Li KS, Huang Y, Tsoi HW, Wong BH, Wong SS, Leung SY, Chan KH, Yuen KY. 2005. Severe acute respiratory syndrome coronavirus-like virus in Chinese horseshoe bats. Proc. Natl. Acad. Sci. U. S. A. 102:14040–14045 - PMC - PubMed
    1. Lau SK, Woo PC, Li KS, Huang Y, Wang M, Lam CS, Xu H, Guo R, Chan KH, Zheng BJ, Yuen KY. 2007. Complete genome sequence of bat coronavirus HKU2 from Chinese horseshoe bats revealed a much smaller spike gene with a different evolutionary lineage from the rest of the genome. Virology 367:428–439 - PMC - PubMed

Publication types

MeSH terms

Substances