

Modeling the acute and chronic phases of Theiler murine encephalomyelitis virus infection
- PMID: 23365440
- PMCID: PMC3624189
- DOI: 10.1128/JVI.03395-12
Modeling the acute and chronic phases of Theiler murine encephalomyelitis virus infection
Abstract
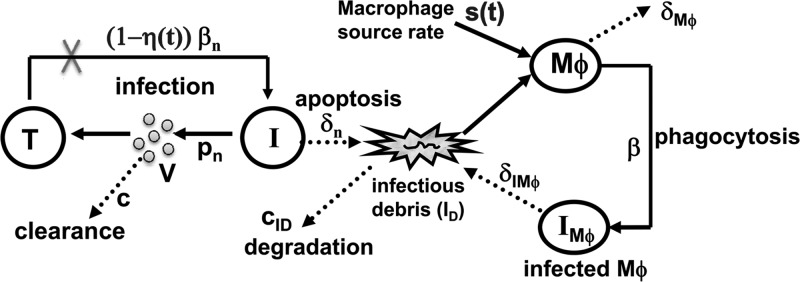
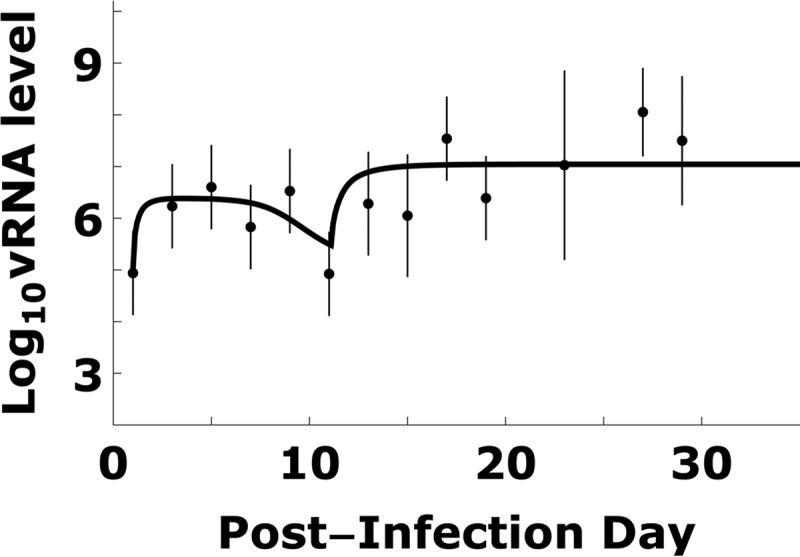
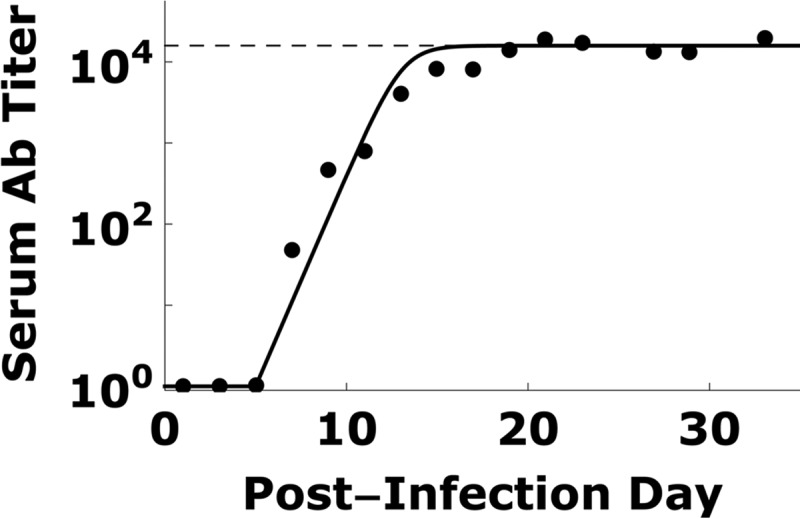
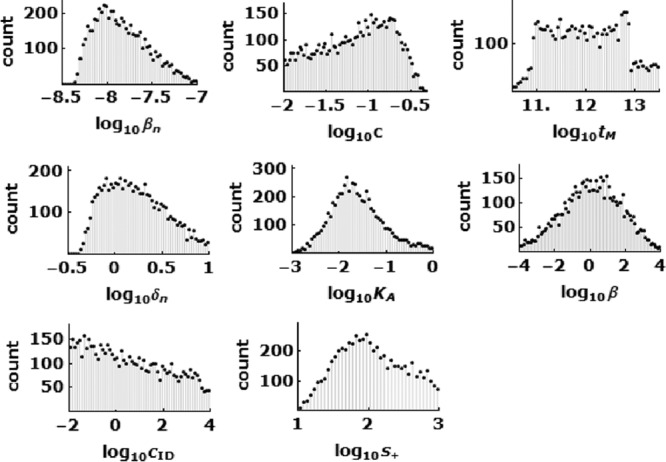
Theiler murine encephalomyelitis virus (TMEV) infection of a mouse's central nervous system is biphasic: first the virus infects motor neurons (acute phase), and this is followed by a chronic phase in which the virus infects glial cells (primarily microglia and macrophages [M]) of the spinal cord white matter, leading to inflammation and demyelination. As such, TMEV-induced demyelinating disease in mice provides a highly relevant experimental animal model for multiple sclerosis. Mathematical models have proven valuable in understanding the in vivo dynamics of persistent virus infections, such as HIV-1, hepatitis B virus, and hepatitis C virus infections. However, viral dynamic modeling has not been used for understanding TMEV infection. We constructed the first mathematical model of TMEV-host kinetics during acute and early chronic infections in mice and fit measured viral kinetic data with the model. The data fitting allowed us to estimate several unknown parameters, including the following: the rate of infection of neurons, 0.5 × 10(-8) to 5.6 × 10(-8) day(-1); the percent reduction of the infection rate due to the presence of virus-specific antibodies, which reaches 98.5 to 99.9% after day 15 postinfection (p.i.); the half-life of infected neurons, 0.1 to 1.2 days; and a cytokine-enhanced macrophage source rate of 25 to 350 M/day into the spinal cord starting at 10.9 to 12.9 days p.i. The model presented here is a first step toward building a comprehensive model for TMEV-induced demyelinating disease. Moreover, the model can serve as an important tool in understanding TMEV infectious mechanisms and may prove useful in evaluating antivirals and/or therapeutic modalities to prevent or inhibit demyelination.
Figures
Similar articles
-
Neuropathogenesis of Theiler's murine encephalomyelitis virus infection, an animal model for multiple sclerosis.J Neuroimmune Pharmacol. 2010 Sep;5(3):355-69. doi: 10.1007/s11481-009-9179-x. Epub 2009 Nov 6. J Neuroimmune Pharmacol. 2010. PMID: 19894121 Free PMC article. Review.
-
MMP-12, MMP-3, and TIMP-1 are markedly upregulated in chronic demyelinating theiler murine encephalomyelitis.J Neuropathol Exp Neurol. 2006 Aug;65(8):783-93. doi: 10.1097/01.jnen.0000229990.32795.0d. J Neuropathol Exp Neurol. 2006. PMID: 16896312
-
Theiler's murine encephalomyelitis virus induces rapid necrosis and delayed apoptosis in myelinated mouse cerebellar explant cultures.Brain Res. 2000 Jun 23;868(2):259-67. doi: 10.1016/s0006-8993(00)02338-6. Brain Res. 2000. PMID: 10854578
-
Double-edged effects of tamoxifen-in-oil-gavage on an infectious murine model for multiple sclerosis.Brain Pathol. 2021 Nov;31(6):e12994. doi: 10.1111/bpa.12994. Epub 2021 Jun 17. Brain Pathol. 2021. PMID: 34137105 Free PMC article.
-
Two models for multiple sclerosis: experimental allergic encephalomyelitis and Theiler's murine encephalomyelitis virus.J Neuropathol Exp Neurol. 1996 Jun;55(6):673-86. doi: 10.1097/00005072-199606000-00001. J Neuropathol Exp Neurol. 1996. PMID: 8642393 Review.
Cited by
-
A Parameter Estimation Method for Multiscale Models of Hepatitis C Virus Dynamics.Bull Math Biol. 2019 Oct;81(10):3675-3721. doi: 10.1007/s11538-019-00644-7. Epub 2019 Jul 23. Bull Math Biol. 2019. PMID: 31338739 Free PMC article.
-
Epstein-Barr Virus (EBV) Epithelial Associated Malignancies: Exploring Pathologies and Current Treatments.Int J Mol Sci. 2022 Nov 19;23(22):14389. doi: 10.3390/ijms232214389. Int J Mol Sci. 2022. PMID: 36430864 Free PMC article. Review.
-
Modeling suggests that virion production cycles within individual cells is key to understanding acute hepatitis B virus infection kinetics.PLoS Comput Biol. 2023 Aug 3;19(8):e1011309. doi: 10.1371/journal.pcbi.1011309. eCollection 2023 Aug. PLoS Comput Biol. 2023. PMID: 37535676 Free PMC article.
-
Numerical schemes for solving and optimizing multiscale models with age of hepatitis C virus dynamics.Math Biosci. 2018 Jun;300:1-13. doi: 10.1016/j.mbs.2018.03.011. Epub 2018 Mar 15. Math Biosci. 2018. PMID: 29550297 Free PMC article.
-
CD28-signaling can be partially compensated in CD28-knockout mice but is essential for virus elimination in a murine model of multiple sclerosis.Front Immunol. 2023 Apr 5;14:1105432. doi: 10.3389/fimmu.2023.1105432. eCollection 2023. Front Immunol. 2023. PMID: 37090733 Free PMC article.
References
-
- Ercolini AM, Miller SD. 2006. Mechanisms of immunopathology in murine models of central nervous system demyelinating disease. J. Immunol. 176:3293–3298 - PubMed
-
- Brahic M, Bureau JF, Michiels T. 2005. The genetics of the persistent infection and demyelinating disease caused by Theiler's virus. Annu. Rev. Microbiol. 59:279–298 - PubMed
-
- Ohara Y, Stein S, Fu JL, Stillman L, Klaman L, Roos RP. 1988. Molecular cloning and sequence determination of DA strain of Theiler's murine encephalomyelitis viruses. Virology 164:245–255 - PubMed
Publication types
MeSH terms
Substances
Grants and funding
- R01 OD011095/OD/NIH HHS/United States
- NS065945/NS/NINDS NIH HHS/United States
- AI028433/AI/NIAID NIH HHS/United States
- R37 AI028433/AI/NIAID NIH HHS/United States
- P20 GM103452/GM/NIGMS NIH HHS/United States
- R01 AI028433/AI/NIAID NIH HHS/United States
- OD011095/OD/NIH HHS/United States
- R01 AI078881/AI/NIAID NIH HHS/United States
- R56/R01-AI078881/AI/NIAID NIH HHS/United States
- P20-GM103452/GM/NIGMS NIH HHS/United States
- R01 NS065945/NS/NINDS NIH HHS/United States
- R56 AI078881/AI/NIAID NIH HHS/United States
LinkOut - more resources
Full Text Sources
Other Literature Sources
Medical
Research Materials
