Polymer uncrossing and knotting in protein folding, and their role in minimal folding pathways
- PMID: 23365638
- PMCID: PMC3554774
- DOI: 10.1371/journal.pone.0053642
Polymer uncrossing and knotting in protein folding, and their role in minimal folding pathways
Abstract
We introduce a method for calculating the extent to which chain non-crossing is important in the most efficient, optimal trajectories or pathways for a protein to fold. This involves recording all unphysical crossing events of a ghost chain, and calculating the minimal uncrossing cost that would have been required to avoid such events. A depth-first tree search algorithm is applied to find minimal transformations to fold [Formula: see text], [Formula: see text], [Formula: see text], and knotted proteins. In all cases, the extra uncrossing/non-crossing distance is a small fraction of the total distance travelled by a ghost chain. Different structural classes may be distinguished by the amount of extra uncrossing distance, and the effectiveness of such discrimination is compared with other order parameters. It was seen that non-crossing distance over chain length provided the best discrimination between structural and kinetic classes. The scaling of non-crossing distance with chain length implies an inevitable crossover to entanglement-dominated folding mechanisms for sufficiently long chains. We further quantify the minimal folding pathways by collecting the sequence of uncrossing moves, which generally involve leg, loop, and elbow-like uncrossing moves, and rendering the collection of these moves over the unfolded ensemble as a multiple-transformation "alignment". The consensus minimal pathway is constructed and shown schematically for representative cases of an [Formula: see text], [Formula: see text], and knotted protein. An overlap parameter is defined between pathways; we find that [Formula: see text] proteins have minimal overlap indicating diverse folding pathways, knotted proteins are highly constrained to follow a dominant pathway, and [Formula: see text] proteins are somewhere in between. Thus we have shown how topological chain constraints can induce dominant pathway mechanisms in protein folding.
Conflict of interest statement
Figures
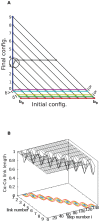
 ) is “snapped” into the final conformation because its distance to the destination is less than
  (going from D to E). In the intermediate conformation F (Gray), beads 0 to 3 have reached their final locations and no longer move. Note also the link length violation of link 4 in conformation F, due to the approximation that ignores end point rotations, for this intermediate figure. A milder violation is observed when going from D (cyan) to E (magenta), since bead 1 through
  all assume a step size of
  while bead 0 moved a step size
  . (b) Panel b shows a surface plot showing link length as a function of link number and step number during transformation. For the whole process, mean link length
  is 0.98 units and standard deviation
  is 0.063.

 and
and  , where the chain is parametrized uniformly from 0 to 3. Since link 1 is under link 3 at the point of projection crossing, 0.29 will appear with a negative sign in the corresponding
  (eqn 1). (b) The blue chain and the red chain have the exact same vertical projection, however their corresponding
  matrices are different in sign, as given in Eq. 2. This indicates that the over-under sense has changed for the links whose projections are crossing. This in turn indicates that a true crossing has occurred when going from the red conformation to the blue conformation, as opposed to a series of conformations where the chain has navigated to conformations having the opposite crossing sense without passing through itself.


 ,
,  ,
,  which then terminates because the accumulated distance exceeds the minimum so far of 25, and
  .
.
 and
and  . Knotted proteins are indicated as green circles and are clustered; unknotted proteins are clustered using with the black closed curve, and contain
  -helical proteins clustered in red, and mixed
  -
- proteins clustered in magenta. Beta proteins are indicated in blue. Two and three state proteins are indicated as triangles and squares respectively. LRO provides a strong discriminant agains
  and mixed proteins, but not knotted and unknotted proteins, while
  discriminates knotted from unknotted proteins, and moderately discriminates
  proteins from mixed proteins. (B) Scatter plot of all proteins as a function of
  and
and  . The rendering scheme for protein classes is the same as in panel (A). Kinetic 2-state folders are indicated by the black dashed curve. Both
  and
and  distinguish knotted from unknotted proteins, and 2-state from 3-state proteins. By projecting
  proteins and either mixed
  /
/ or all-
 proteins onto each order parameter, one can see how
  can discriminate
  proteins from both mixed or
  proteins, while
  cannot. This is despite the significant correlation between
  and
and  .
.
 for statistical significance.
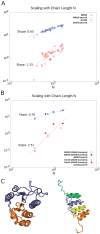
 , across proteins and for domains within a single protein. (A) MRSD (blue circles) as a function of chain length
  for our protein dataset. The slope of the best fit line on the log-log plot gives the power law scaling:
  . Non-crossing distance per residue
  (red circles) vs.
 shows much larger scatter across native topologies, but follows an approximate scaling law
  which is superextensive, indicating an increasing importance of chain non-crossing per residue as system size is increased. At system sizes larger than
  , even minimal motion is dominated by entanglement. (B) Same quantities as in panel (A), but for the domains in proteins 2A5E and 2HA8. The scaling laws are different than in panel (A), and show stronger chain-length dependence. For 2HA8, domains 1, 2 and 1-2 together (the full protein) are considered; for 2A5E domains 1,2,3,4, 1-2, 2-3, 3-4, 1-2-3, 2-3-4, and 1-2-3-4 (the full protein) are considered. Based on these scaling laws found by building up proteins from subdomains, at system sizes larger than
  , minimal pathways become entanglement-dominated. (C) Schematic renderings of the domains, color-coded in 2HA8 (left) and 2A5E (right).
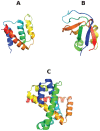
 protein; (B) Src homology 3 (SH3) domain of phosphatidylinositol 3-kinase, PDB id 1PKS , a largely
  protein; (C) The designed knotted protein 2ouf-knot, PDB id 3MLG .
 ) uncrossing, green bars indicate C-terminal leg (
 ) uncrossing, blue bars indicate Reidemeister “pinch and twist” loop uncrossing moves, and cyan bars indicate elbow uncrossing moves. The same set of 172 transformations is shown in panels A and B. Panel A sorts uncrossing transformations by rank ordering the following move types, largest to smallest:
  ,
,  , loop uncrossing, elbow move. Panel B sorts moves by
  ,
,  , loop uncrossing, elbow move. The scale bar underneath each panel indicates a distance of 100 in units of the link length. The arrow in each panel denotes the “most representative” transformation, as defined in the text.
 uncrossing moves; green bars:
  uncrossing moves; Blue bars: loop uncrossing moves; Cyan bars: elbow uncrossing moves. The same set of 195 transformations is shown in panels A and B, sorted as in Figure 19. The scale bar underneath each panel indicates a distance of 100 in units of the link length.
 uncrossing moves; green bars:
  uncrossing moves; Blue bars: loop uncrossing moves; Cyan bars: elbow uncrossing moves. The same set of 90 transformations is shown in panels A and B, sorted as in Figure 19. The scale bar underneath each panel indicates a distance of 100 in units of the link length. The arrow in each panel denotes the “most representative” transformation, as defined in the text. The transformation located 8 bars up from the bottom of Panel A requires both
  and
and  moves, however both leg motions are very small.
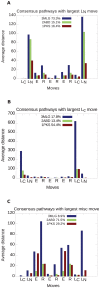
 or
or  ), elbow
  , or loop
  . The order of the sequence of moves is taken from right to left along the x-axis. An all-
 protein (2ABD), an all-
 protein (1PKS), and a knotted protein (3MLG) are considered. (A) Transformations with leg
  as the largest move. These encompass 15% of the transformations those in the
  protein, 16% of the transformations in the
  protein, and 73% of the transformations for the knotted protein. (B) Transformations with leg
  as the largest move, which encompass 13% of the
  protein transformations, 54% of
  protein transformations, and 18% of knotted protein transformations. (C) Transformations with either an elbow E or loop R as the largest move, which encompass 71% of the
  protein transformations, 29% of
  protein transformations, and 9% of knotted protein transformations.
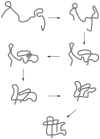
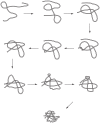

 and
and  , to illustrate the sequence overlap between transformations.
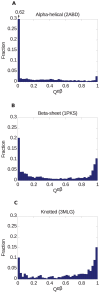
 ) distributions for the 3 proteins in Figure 18, as defined by Equation (8), operating on the transformations in Figure 19, 20, 21. (a) The pathway overlap distribution for the all-
 protein 2ABD indicates a large contribution for
  (the peak height in the distribution is
  ), indicating a diverse set of minimal transformations fold the protein. The average
  for these transformations is
  . (b) The pathway overlap distribution for the
  -protein shows the emergence of a peak around
  , indicating partial restriction of folding pathways. The peak near
  still carries more weight in the distribution. The average
  . (c) The peak around
  becomes dominant for the pathway overlap distribution of the knotted protein, indicating the emergence of a dominant restricted minimal folding pathway. The average
  .
.References
-
- Wolynes PG (1992) Spin glass ideas and the protein folding problems. In: Stein D, editor, Spin Glasses and Biology. Singapore: World Scientific, pp. 225–259.
-
- Chan HS, Dill KA (1993) The protein folding problem. Phys Today 46: 24–32.
-
- Wolynes PG, Onuchic JN, Thirumalai D (1995) Navigating the folding routes. Science 267: 1619–1620. - PubMed
-
- Garel T, Orland H, Thirumalai D (1996) Analytical theories of protein folding. In: Elber R, editor, New Developments in theoretical studies of proteins, Singapore: World Scientific. pp. 197–268.
-
- Dobson CM, Sali A, Karplus M (1998) Protein folding: A perspective from theory and experiment. Angew Chem Int Ed Engl 37: 868–893. - PubMed
Publication types
MeSH terms
Substances
LinkOut - more resources
Full Text Sources
Other Literature Sources

