. 2012:2012:5502-5.
doi: 10.1109/EMBC.2012.6347240.

Modeling spatial population dynamics of stem cell lineage in tissue growth

Affiliations

Modeling spatial population dynamics of stem cell lineage in tissue growth

Youfang Cao et al. Annu Int Conf IEEE Eng Med Biol Soc. 2012.

Abstract

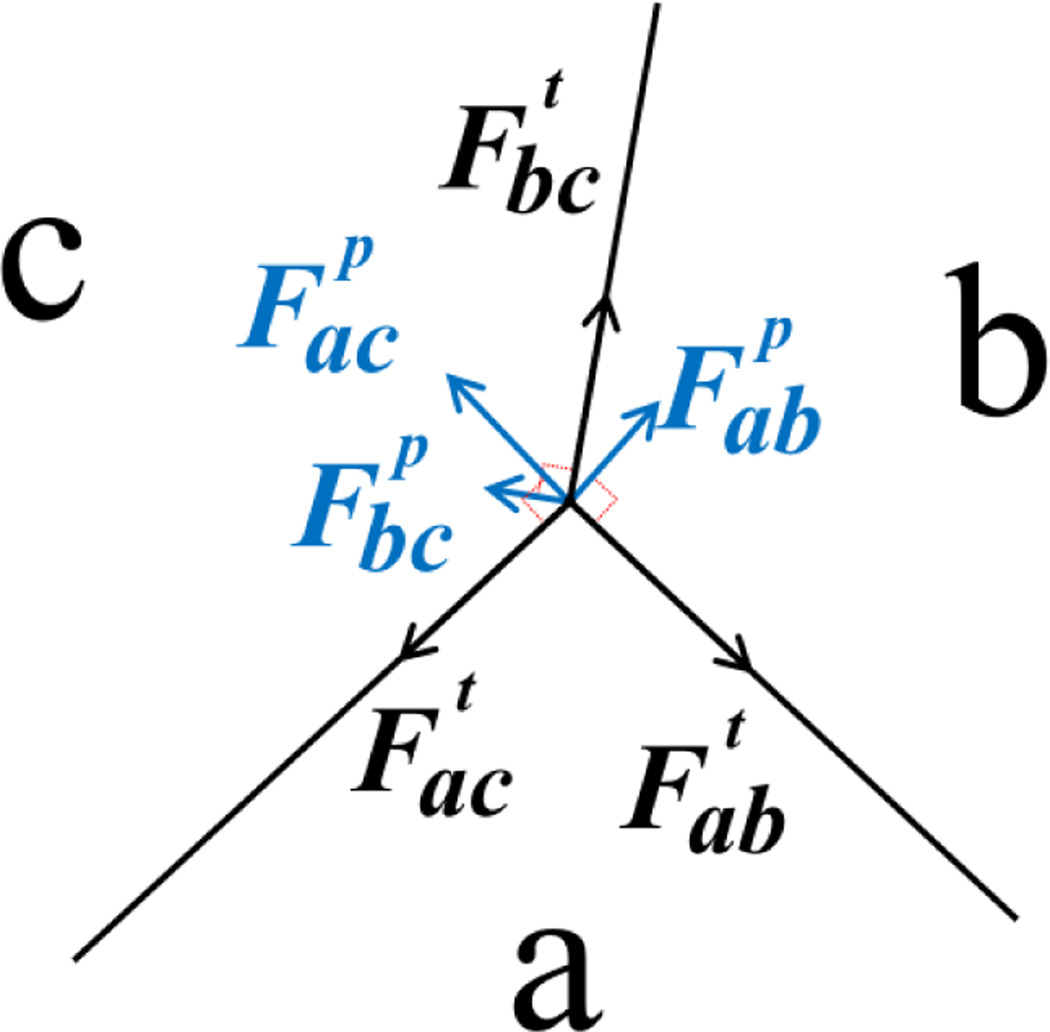
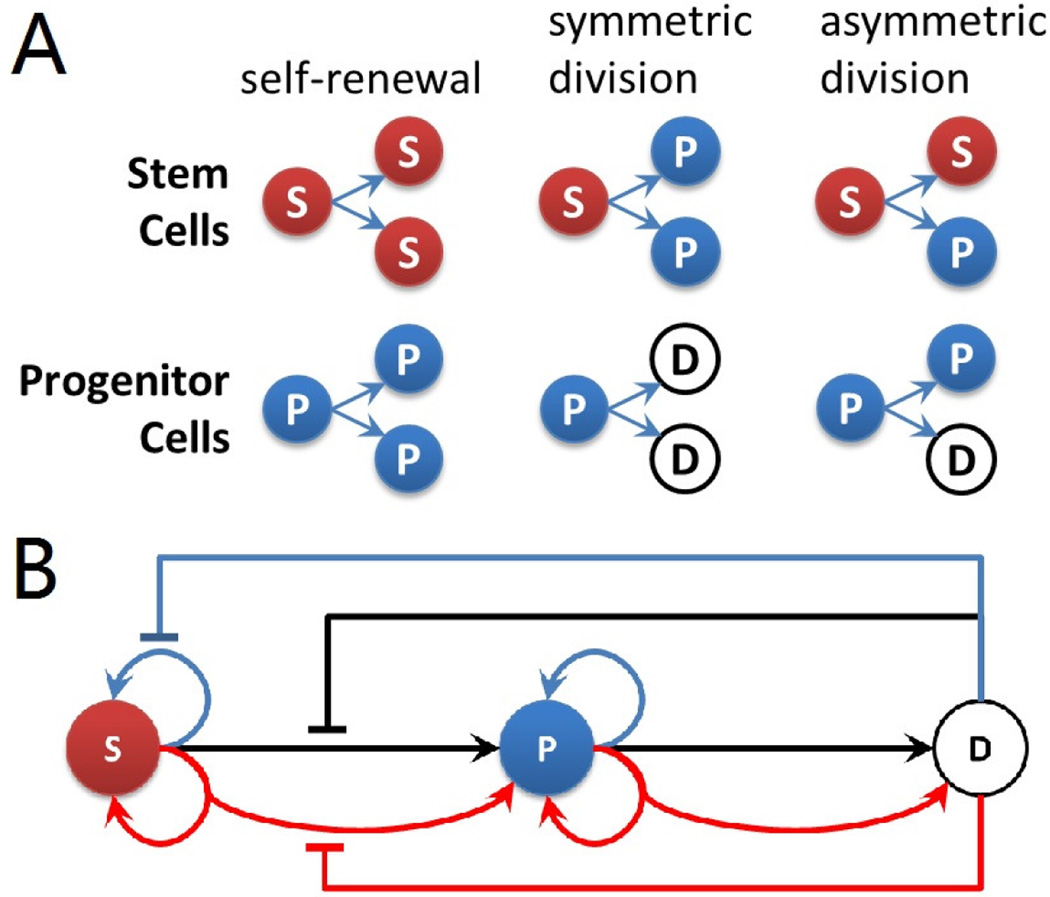
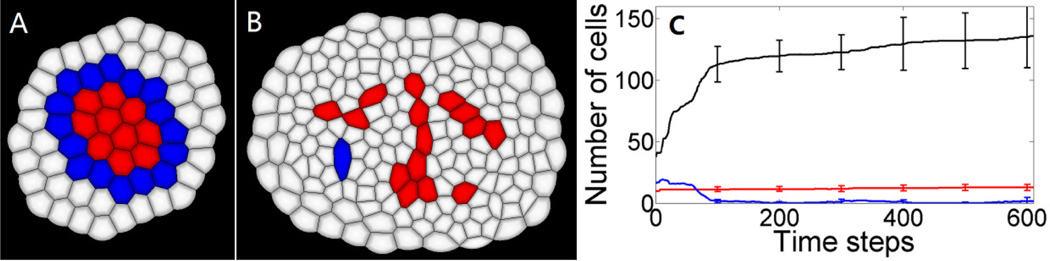
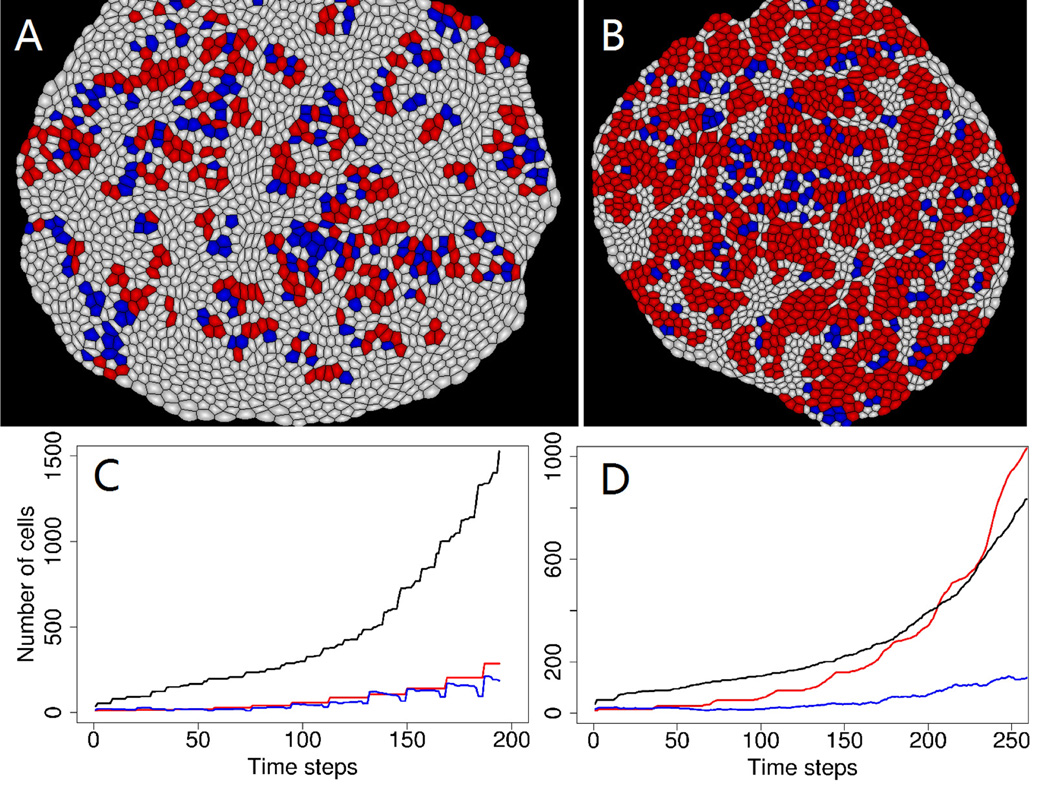
Understanding the dynamics of cell population allows insight into the control mechanism of the growth and development of mammalian tissues. It is well known that the proliferation and differentiation among stem cells (SCs), intermediate progenitor cells (IPCs), and fully differentiated cells (FDCs) are under different activation and inhibition controls. Secreted factors in negative feedback loops have already been identified as major elements in regulating the numbers of different cell types and in maintaining the equilibrium of cell populations. We have developed a novel spatial dynamic model of cells. We can characterize not only overall cell population dynamics, but also details of temporal-spatial relationship of individual cells within a tissue. In our model, the shape, growth, and division of each cell are modeled using a realistic geometric model. Furthermore, the inhibited growth rate, proliferation and differentiation probabilities of individual cells are modeled through feedback loops controlled by secreted factors of neighboring cells within a proper diffusion radius. With specific proliferation and differentiation probabilities, the actual division type that each cell will take is chosen by a Monte Carlo sampling process. With simulations we found that with proper strengths of inhibitions to growth and stem cell divisions, the whole tissue is capable of achieving a homeostatic size control. We discuss our findings on control mechanisms of the stability of the tissue development. Our model can be applied to study broad issues on tissue development and pattern formation in stem cell and cancer research.


Figures

Fig. 1
Fig. 1
The forces at the junction vertex of three cells a, b and c. Tension is tangential to the edge (black). Pressure is normal to the edge (blue). The net force on the junction vertex is obtained by summing tension and pressure acting on the vertex.
Fig. 2
Fig. 2
(A) Division types of stem cells and progenitor cells. Red sphere labeled with (S) indicates stem cells, blue sphere (P) indicates progenitor cells, and white sphere (D) indicates differentiated cell. The same color code is used for illustration of resulting tissues. (B) Feedback controls of stem cell model. Blue arrows indicate self-renewal or proliferation divisions. Black arrows indicate symmetric divisions. Red arrows indicate asymmetric divisions. Flat-head arrows extending from differentiated cell with corresponding colors indicate inhibitions to respective type of divisions.
Fig. 3
Fig. 3
Size control of tissue development. (A) Small starting tissue for numerical simulations of the temporal-spatial dynamics model contains 64 cells in total. Stem cells are labeled in red, progenitor cells are in blue, and differentiated cells are in white. (B) One example tissue achieved homeostatic size control. This steady state tissue contains 15 stem cells, 1 progenitor cell and 158 differentiated cells. (C) Dynamics of cell numbers during tissue development. The red curve indicates the change of stem cell numbers, the blue line is for progenitor cells, and the black line is differentiated cells. Error bars show the standard deviations calculated from four simulation results at 100, 200, 300, 400, 500, and 600 time steps, respectively.
Fig. 4
Fig. 4
(A) A snapshot of simulations in tissue without any negative feedback controls. (B) A snapshot of simulations in tissue without inhibition to stem cell self-renewal. (C) Dynamics of cell numbers in tissue without any inhibitions. The red curve indicates the change of stem cell numbers, the blue line is for progenitor cells, and the black line is differentiated cells. (D) Dynamics of cell numbers in tissue without any inhibitions. The red curve indicates the change of stem cell numbers, the blue line is for progenitor cells, and the black line is differentiated cells.

References

    1. Lander AD. Pattern, Growth, and Control. Cell. 2011 Mar 18;vol. 144:955–969. - PMC - PubMed
    1. Lander AD, Gokoffski KK, Wan FYM, Nie Q, Calof AL. Cell Lineages and the Logic of Proliferative Control. PLoS Biology. 2009 Jan;vol. 7:e1000015. - PMC - PubMed
    1. Lo WC, Chou CS, Gokoffski KK, Wan FY-M, Lander AD, Calof AL, Nie Q. Feedback regulation in multistage cell lineages. Mathematical Biosciences and Engineering. 2009;vol. 6(No. 1):59–82. - PMC - PubMed
    1. Christley S, Lee B, Dai X, Nie Q. Integrative multicellular biological modeling: a case study of 3D epidermal development using GPU algorithms. BMC Systems Biology. 2010;vol. 4:107. - PMC - PubMed
    1. Wu HH, Ivkovic S, Murray RC, Jaramillo S, Lyons KM, Johnson JE, Calof AL. Autoregulation of neurogenesis by GDF11. Neuron. 2003;vol. 37(No. 2):197–207. - PubMed

Publication types

LinkOut - more resources