

Comparison of class 2 transposable elements at superfamily resolution reveals conserved and distinct features in cereal grass genomes
- PMID: 23369001
- PMCID: PMC3579700
- DOI: 10.1186/1471-2164-14-71
Comparison of class 2 transposable elements at superfamily resolution reveals conserved and distinct features in cereal grass genomes
Abstract
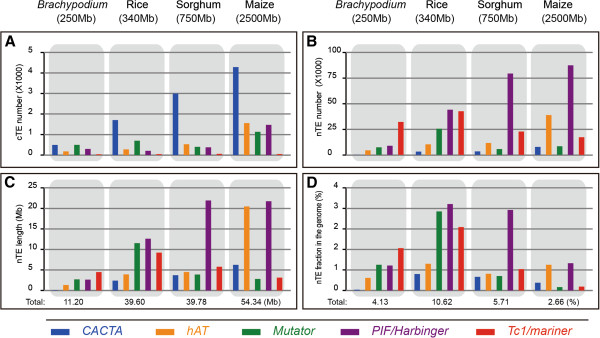
Background: Class 2 transposable elements (TEs) are the predominant elements in and around plant genes where they generate significant allelic diversity. Using the complete sequences of four grasses, we have performed a novel comparative analysis of class 2 TEs. To ensure consistent comparative analyses, we re-annotated class 2 TEs in Brachypodium distachyon, Oryza sativa (rice), Sorghum bicolor and Zea mays and assigned them to one of the five cut-and-paste superfamilies found in plant genomes (Tc1/mariner, PIF/Harbinger, hAT, Mutator, CACTA). We have focused on noncoding elements because of their abundance, and compared superfamily copy number, size and genomic distribution as well as correlation with the level of nearby gene expression.
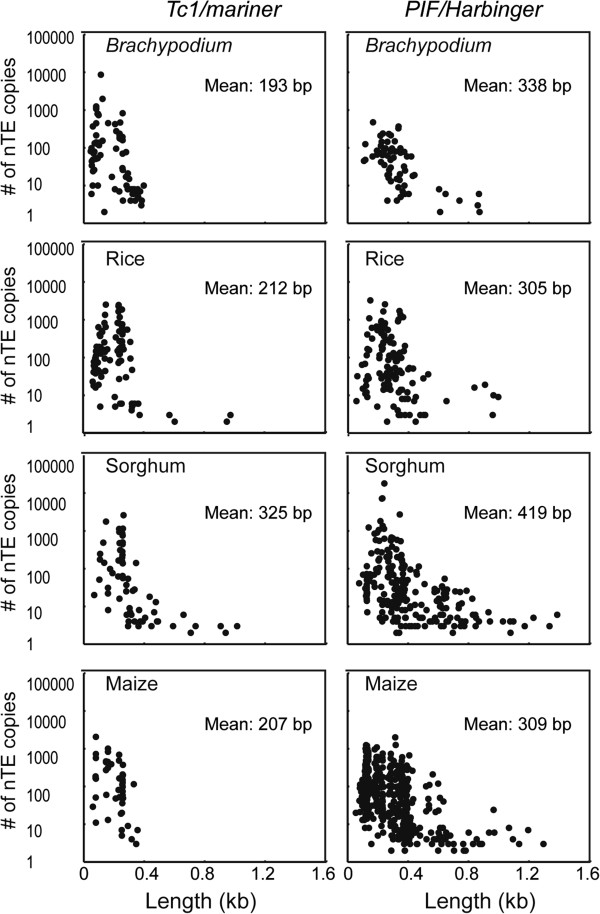
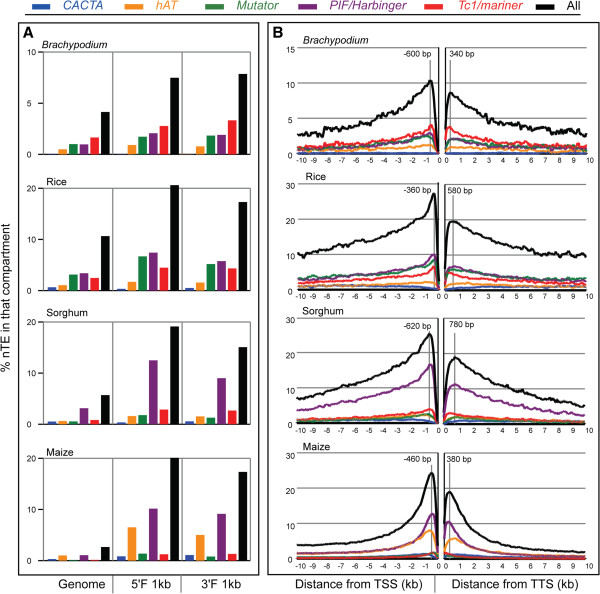
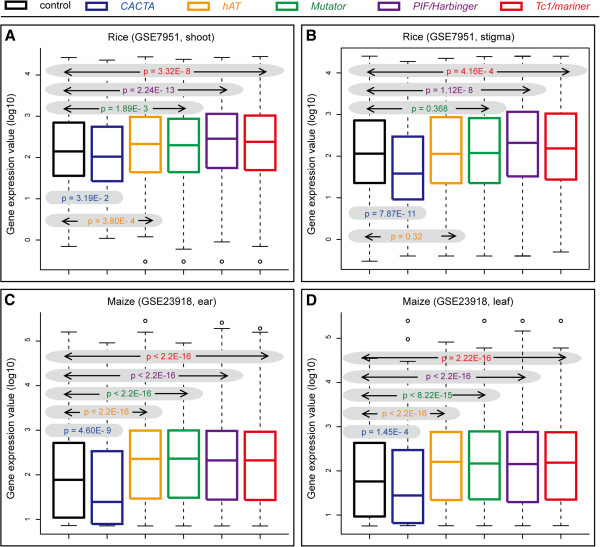
Results: Our comparison revealed both unique and conserved features. First, the average length or size distribution of elements in each superfamily is largely conserved, with the shortest always being Tc1/mariner elements, followed by PIF/Harbinger, hAT, Mutator and CACTA. This order also holds for the ratio of the copy numbers of noncoding to coding elements. Second, with the exception of CACTAs, noncoding TEs are enriched within and flanking genes, where they display conserved distribution patterns, having the highest peak in the promoter region. Finally, our analysis of microarray data revealed that genes associated with Tc1/mariner and PIF/Harbinger noncoding elements have significantly higher expression levels than genes without class 2 TEs. In contrast, genes with CACTA elements have significantly lower expression than genes without class 2 TEs.
Conclusions: We have achieved the most comprehensive annotation of class 2 TEs to date in these four grass genomes. Comparative analysis of this robust dataset led to the identification of several previously unknown features of each superfamily related to copy number, element size, genomic distribution and correlation with the expression levels of nearby genes. These results highlight the importance of distinguishing TE superfamilies when assessing their impact on gene and genome evolution.
Figures
References
-
- Schnable PS, Ware D, Fulton RS, Stein JC, Wei F, Pasternak S, Liang C, Zhang J, Fulton L, Graves TA. et al.The B73 maize genome: complexity, diversity, and dynamics. Science. 2009;326(5956):1112–1115. - PubMed
-
- Bennetzen JL. Transposable element contributions to plant gene and genome evolution. Plant Mol Biol. 2000;42(1):251–269. - PubMed
Publication types
MeSH terms
Substances
LinkOut - more resources
Full Text Sources
Other Literature Sources
