. 2013 Jan 31:11:11.
doi: 10.1186/1741-7007-11-11.

Multi-channel acoustic recording and automated analysis of Drosophila courtship songs

Affiliations

Multi-channel acoustic recording and automated analysis of Drosophila courtship songs

Benjamin J Arthur et al. BMC Biol. .

Abstract

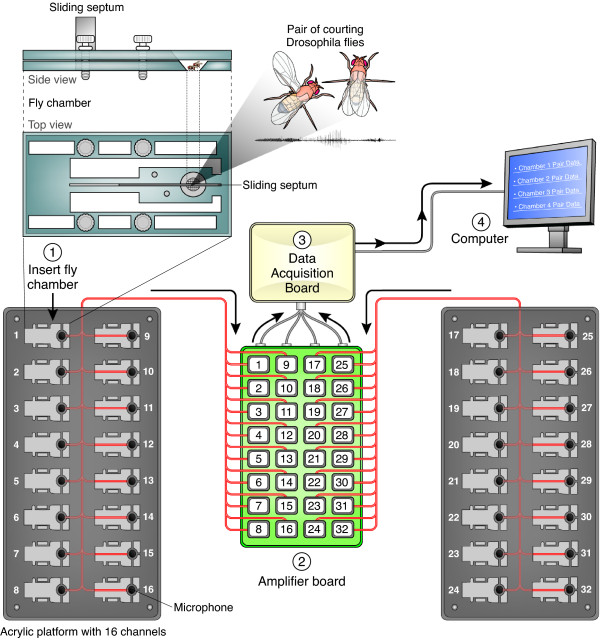
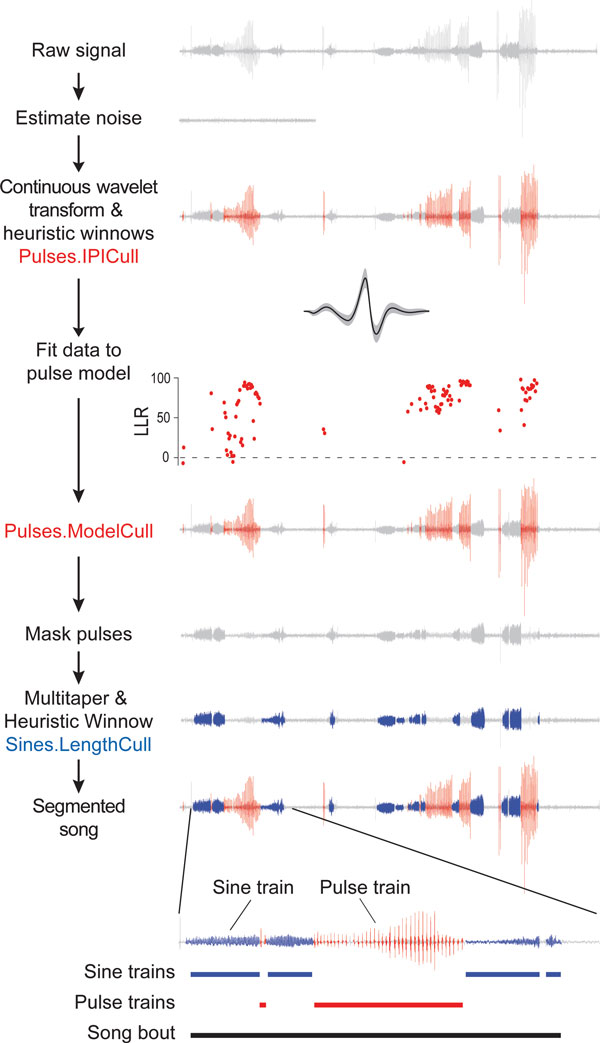
Background: Drosophila melanogaster has served as a powerful model system for genetic studies of courtship songs. To accelerate research on the genetic and neural mechanisms underlying courtship song, we have developed a sensitive recording system to simultaneously capture the acoustic signals from 32 separate pairs of courting flies as well as software for automated segmentation of songs.

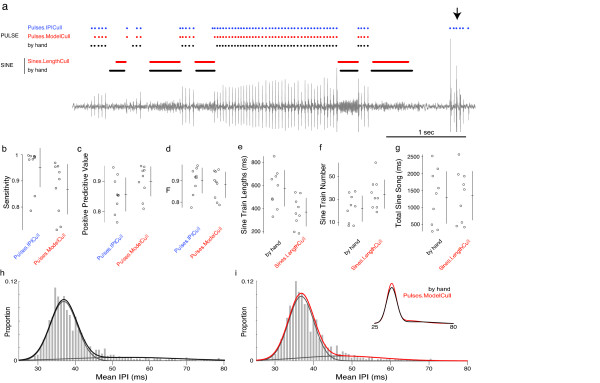
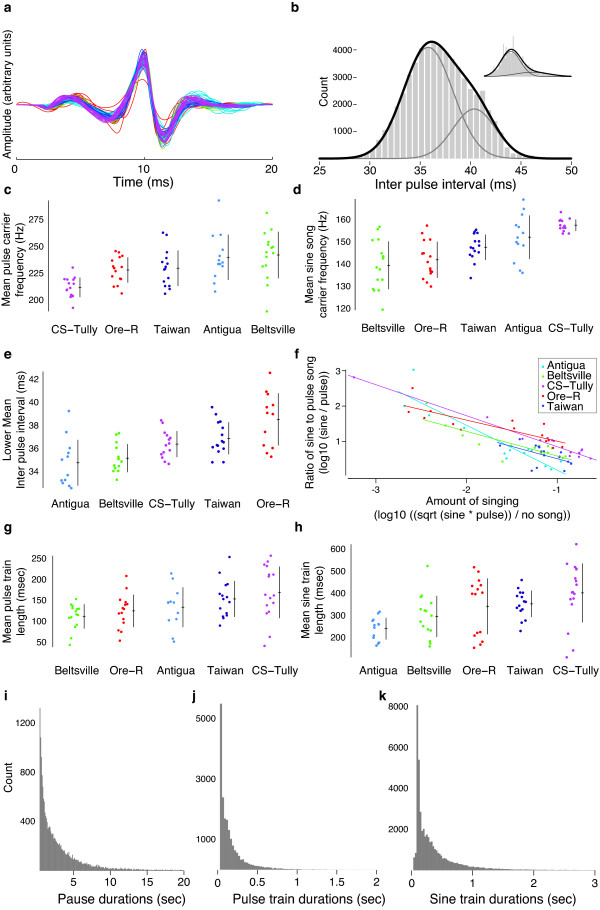
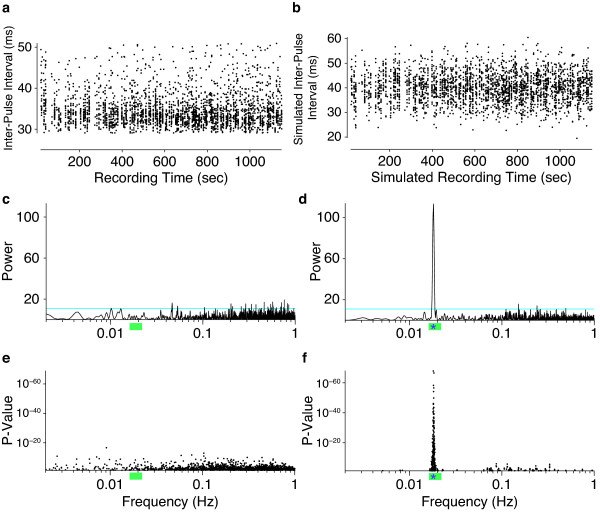
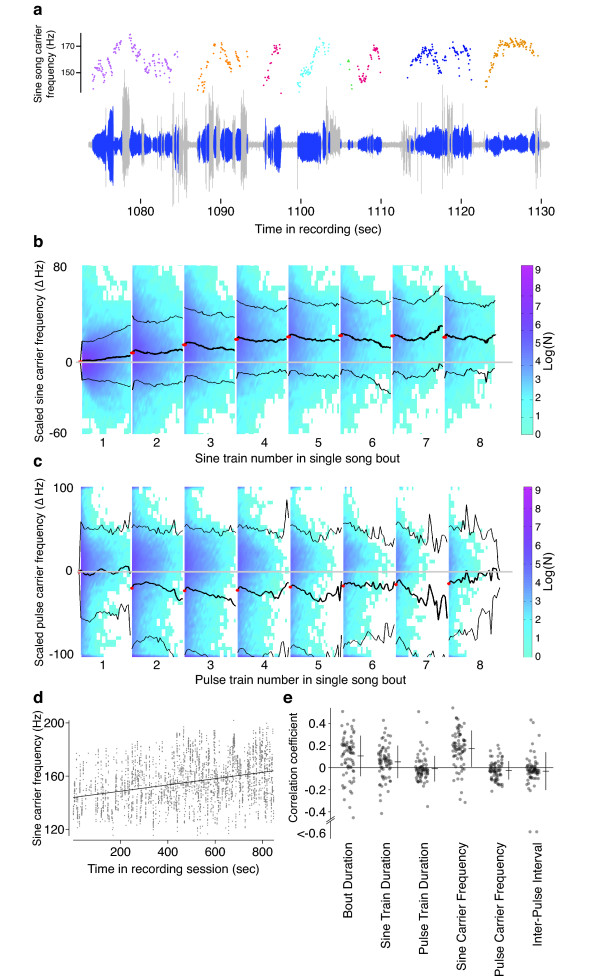
Results: Our novel hardware design enables recording of low amplitude sounds in most laboratory environments. We demonstrate the power of this system by collecting, segmenting and analyzing over 18 hours of courtship song from 75 males from five wild-type strains of Drosophila melanogaster. Our analysis reveals previously undetected modulation of courtship song features and extensive natural genetic variation for most components of courtship song. Despite having a large dataset with sufficient power to detect subtle modulations of song, we were unable to identify previously reported periodic rhythms in the inter-pulse interval of song. We provide detailed instructions for assembling the hardware and for using our open-source segmentation software.

Conclusions: Analysis of a large dataset of acoustic signals from Drosophila melanogaster provides novel insight into the structure and dynamics of species-specific courtship songs. Our new system for recording and analyzing fly acoustic signals should therefore greatly accelerate future studies of the genetics, neurobiology and evolution of courtship song.


Figures

Figure 1
Figure 1
Diagram of 32-channel courtship song recording apparatus. A male and female are introduced into the courtship arena, which has a 5 mm diameter floor, through 2 mm holes in the top piece on either side of a movable steel septum. The chamber is fitted into the acrylic platform, positioning the flies immediately above the 9.7 mm diameter microphone, and the septum is slid back to allow the male and female to interact. Signals from the 32 microphones are amplified on a custom circuit board, converted to digital signals with a National Instruments Data Acquisition Board and recorded on the computer.
Figure 2
Figure 2
Outline of the computational analysis performed by FlySongSegmenter. From top to bottom, the noise floor is estimated from the raw signal. Wavelet analysis is performed to identify putative pulses. We apply two levels of heuristic winnowing, a very conservative winnow based only on amplitude (Pulses.AmpCull) and a stricter winnow that includes amplitude winnowing and that has been tuned to D. melanogaster song (Pulses.IPICull); both results are provided as output. To further refine putative pulses, the log likelihood ratio is then calculated for a D. melanogaster model of pulses versus a model of white noise. One principled way to winnow is to retain only pulses with a log likelihood ratio > 0 (above dotted line), as shown (Pulses.ModelCull). To identify sine trains, the putative pulses are masked and multitaper spectral analysis is applied to masked data (Sines.LengthCull). All of the above steps are performed with a single call to the software and the software can be parallelized easily on a computer cluster. Modeling software is provided with the package to allow users to generate new pulse models from their own recordings. Pulse trains must contain at least two consecutive pulses and song bouts are continuous periods of alternating sine and pulse trains, separated by at least 0.5 seconds from another song bout.
Figure 3
Figure 3
Comparison of FlySongSegmenter with hand-annotated song. We examined the accuracy of FlySongSegmenter by comparing automated segmentation with manual segmentation (manual annotation was performed on 60 seconds of data starting at minute 5 of a recording from each of ten males). (a) Approximately 5 s from a recording from one male showing pulses detected by FlySongSegmenter (blue and red) and manually (black) and sine trains detected by FlySongSegmenter (red) and manually (black). False positive pulses (arrow) are typically removed by winnowing with the pulse model. (b-d) The pulses found before and after model-based culling by FlySongSegmenter were compared to those identified manually (see Methods for more information on these measures). Culling pulses with the pulse model reduced sensitivity (b), but increased the positive predictive value (c). Overall, all methods of culling pulses resulted in similar, high overall accuracy, as measured by the F-score (d). (e-g) FlySongSegmenter often estimated shorter (e) and more (f) sine trains than manual annotation. Overall, FlySongSegmenter estimated approximately equal amounts of total sine song as manual annotation did (g). (h, i) Histograms of inter-pulse interval distributions (pooled across n = 10) of all pulses detected manually (h) or reported in Pulses.ModelCull (i). Overlaid on the histograms are fits from a two-component Gaussian mixture model (black and red lines) and the two underlying Gaussian components (grey lines). The inset in i shows just the mixture model fits for both datasets. IPI: inter-pulse interval.
Figure 4
Figure 4
Statistics of D. melanogaster song. (a) Mean (per individual) re-scaled pulse shapes from five wild-type strains: Antigua = light blue; Beltsville = green; CS-Tully = purple; Oregon-R = red; Taiwan = dark blue. The same colors indicate strains in later panels. (b) Histogram of inter-pulse intervals over the entire dataset. Inset illustrates the distribution for one individual. A two-component Gaussian mixture model (dark line) and the two Gaussian components (light lines) are shown fitted to the data. (c, d) The average pulse (c) and sine train (d) carrier frequencies vary between individuals and amongst strains. (e) The mean inter-pulse interval, here shown for the lower component of a Gaussian mixture model, showed considerable variation amongst strains. (f) The relative amounts of sine and pulse trains were treated as a "three-way choice' - between sine train, pulse train, and no song - and plotted as recommended by Schilling et al. [45]. This method reveals that flies that produced more song overall sang proportionately fewer sine trains relative to pulse trains. In addition, strains displayed significant heterogeneity in the relative amounts of sine and pulse trains that they produced. (g,h) Both pulse train length (g) and sine train length (h) exhibit variation amongst strains. (i-k) The duration of all pauses between song bouts (i), the duration of pulse trains (j), and the duration of sine trains (k) each exhibit extensive variation.
Figure 5
Figure 5
Statistical analysis of rhythms in the inter-pulse interval. (a) An example of inter-pulse intervals produced by a single individual during a single recording session. (b) An example of simulated inter-pulse intervals with a periodicity of 0.018 Hz, a SNR = 1, and sampling times derived from the data in panel a. (c,d) The Lomb-Scargle periodograms for the real data shown in panel a (c) and for the simulated data shown in panel b (d). Horizontal cyan lines indicate power where P = 0.05. (e, f) P-values of the local peaks in the Lomb-Scargle periodograms of inter-pulse interval for all 75 recordings of D. melanogaster (e) and for all 75 simulated datasets with a SNR = 1 (f) over the range of 0 to 1 Hz. Only P-values below 0.05 are plotted. The green bars below the axes in c-f mark the range of 0.016 to 0.22 Hz, which is the reported range of rhythms in the inter-pulse interval [9,21-23,46]. The asterisks within the green bars in d and f indicate 0.018 Hz, the frequency used in these simulations. The naturally skewed distribution of the real data, for example in panel a, differs from the distribution in the simulated data. We found, however, that culling the data to generate Gaussian distributed inter-pulse interval data resulted in even fewer significant peaks in the periodograms than shown in panel e and no obvious clustering of peaks in any particular frequency range (not shown). SNR: signal-to-noise ratio.
Figure 6
Figure 6
Song dynamics in bouts. (a) The carrier frequency of sine trains is modulated during song bouts. An example raw song trace is shown below in grey with sine trains shown in blue and the sine carrier frequency, measured in 50 ms bins, is shown as colored points above. Different colors indicate separate bouts of song. (b) Averaged across the entire dataset, the sine carrier frequency tends to increase over the course of a single bout. The frequency of sine trains within a bout was subtracted from the mean frequency of the initial bin of the first sine train. Histograms of the distribution of data at each time point are illustrated as colored plots across time, with a scale bar on the right indicating the log of the sample size. The mean and the standard deviation of the scaled carrier frequency are indicated with bold and thin black lines and the scaled carrier frequency at the beginning of each sine train within a bout is indicated with a red point. (c) The scaled average pulse carrier frequency displays a noisy decreasing trend over the course of a song bout. Colors and symbols as in b. (d) Sine train carrier frequency as a function of recording time for a single individual displays an increase in the mean carrier frequency with time. (e) The correlation coefficients for multiple song parameters as a function of recording time for all individuals for bout duration, sine train duration, pulse train duration, sine carrier frequency, pulse carrier frequency, and inter-pulse interval.

Comment in

  • Can You Hear Me Now?
    Barnhart EL, Clandinin TR. Barnhart EL, et al. Neuron. 2016 Feb 3;89(3):425-7. doi: 10.1016/j.neuron.2016.01.030. Neuron. 2016. PMID: 26844825

References

    1. Grace JL, Shaw KL. Coevolution of male mating signal and female preference during early lineage divergence of the Hawaiian cricket, Laupala cerasina. Evolution. 2011;65:2184–2196. doi: 10.1111/j.1558-5646.2011.01278.x. - DOI - PubMed
    1. Shorey HH. Nature of the sound produced by Drosophila melanogaster during courtship. Science. 1962;137:677–678. doi: 10.1126/science.137.3531.677. - DOI - PubMed
    1. Ewing AW, Bennet-Clark HC. The courtship songs of Drosophila. Behaviour. 1968;31:288–301. doi: 10.1163/156853968X00298. - DOI
    1. Hoy RR, Hoikkala A, Kaneshiro K. Hawaiian courtship songs - evolutionary innovation in communication signals of Drosophila. Science. 1988;240:217–219. doi: 10.1126/science.3127882. - DOI - PubMed
    1. Ritchie MG, Gleason JM. Rapid evolution of courtship song pattern in Drosophila-Willistoni sibling species. J Evolution Biol. 1995;8:463–479. doi: 10.1046/j.1420-9101.1995.8040463.x. - DOI

Publication types

MeSH terms

LinkOut - more resources