. 2013 May;9(5):957-68.
doi: 10.4161/hv.23774. Epub 2013 Jan 31.

High proportions of regulatory B and T cells are associated with decreased cellular responses to pH1N1 influenza vaccine in HIV-infected children and youth (IMPAACT P1088)

Collaborators, Affiliations

High proportions of regulatory B and T cells are associated with decreased cellular responses to pH1N1 influenza vaccine in HIV-infected children and youth (IMPAACT P1088)

Adriana Weinberg et al. Hum Vaccin Immunother. 2013 May.

Abstract

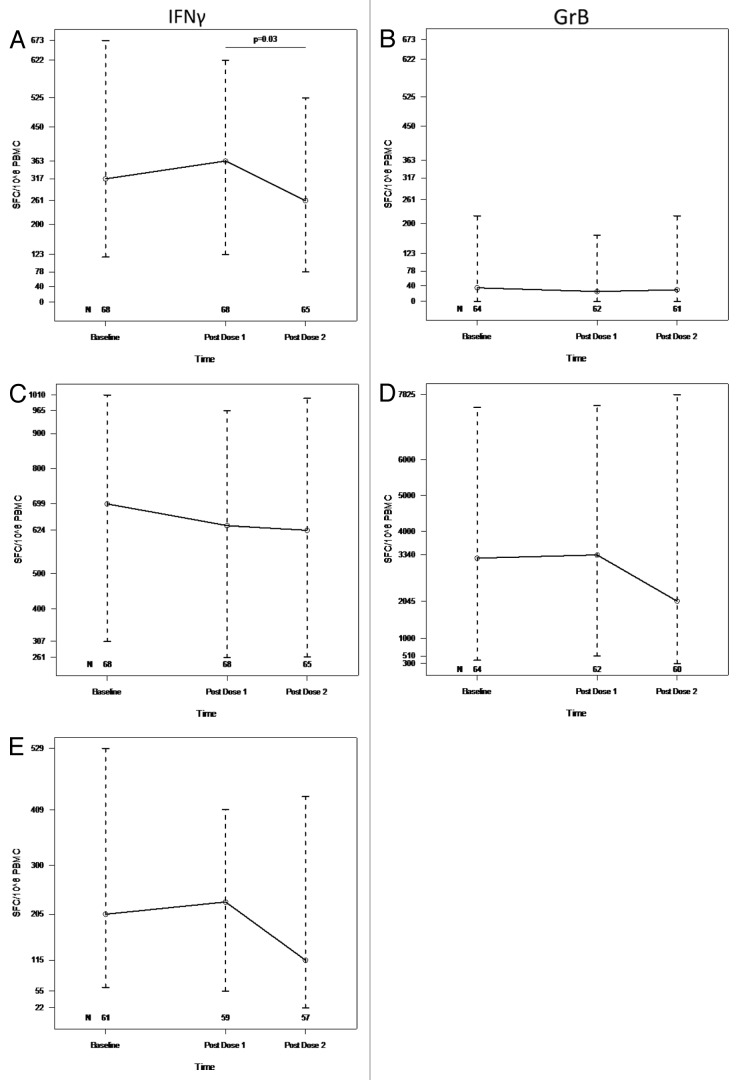
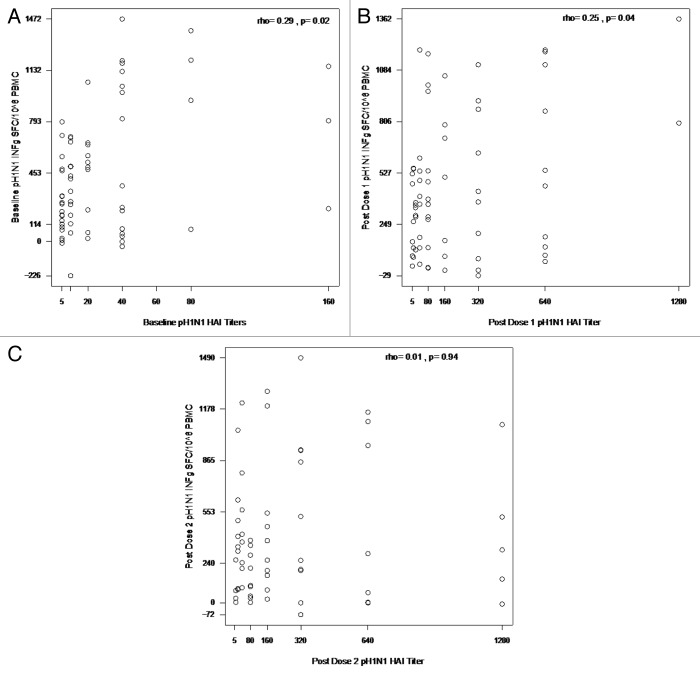
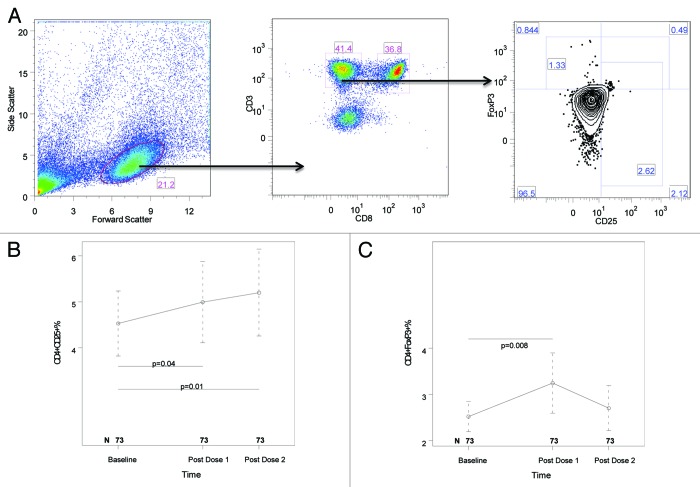
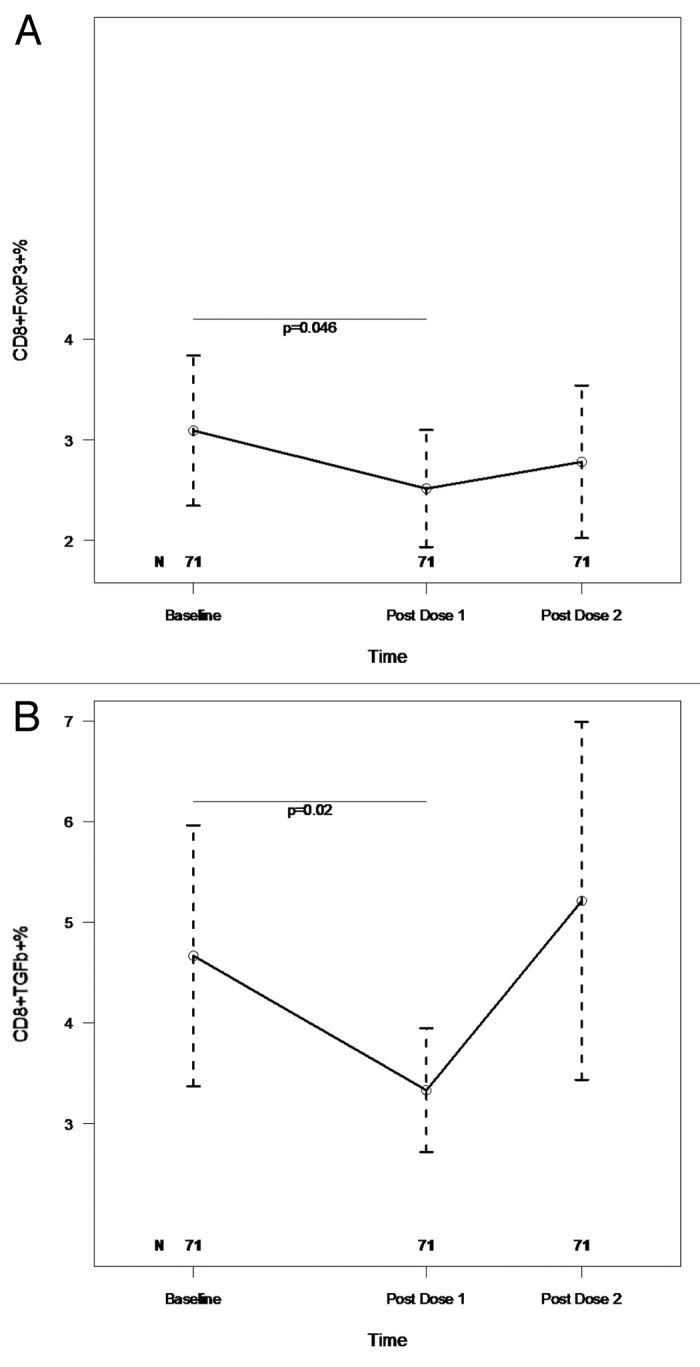
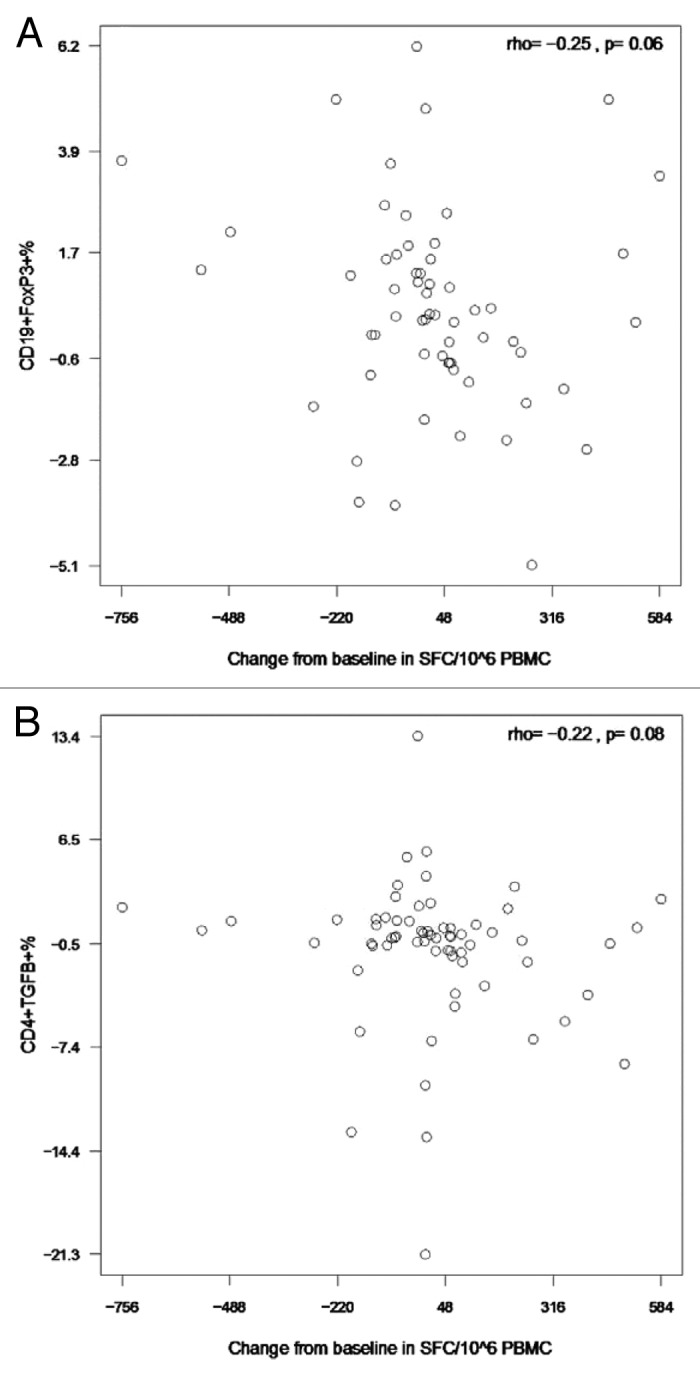
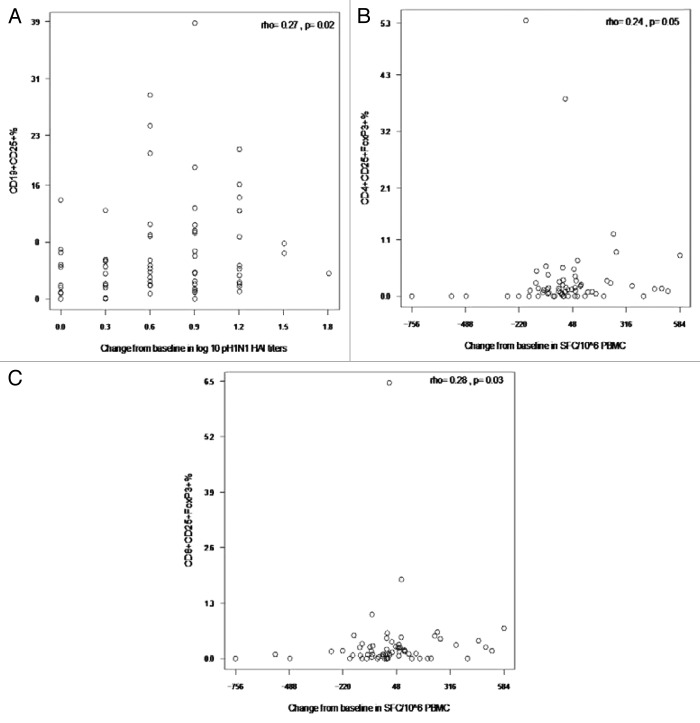
HIV-infected individuals have poor responses to inactivated influenza vaccines. To evaluate the potential role of regulatory T (Treg) and B cells (Breg), we analyzed their correlation with humoral and cell-mediated immune (CMI) responses to pandemic influenza (pH1N1) monovalent vaccine in HIV-infected children and youth. Seventy-four HIV-infected, 4- to 25-y old participants in a 2-dose pH1N1 vaccine study had circulating and pH1N1-stimulated Treg and Breg measured by flow cytometry at baseline, post-dose 1 and post-dose 2. Concomitantly, CMI was measured by ELISPOT and flow cytometry; and antibodies by hemagglutination inhibition (HAI). At baseline, most of the participants had pH1N1-specific IFNγ ELISPOT responses, whose magnitude positively correlated with the baseline pH1N1, but not with seasonal H1N1 HAI titers. pH1N1-specific IFNγ ELISPOT responses did not change post-dose 1 and significantly decreased post-dose 2. In contrast, circulating CD4+CD25+% and CD4+FOXP3+% Treg increased after vaccination. The decrease in IFNγ ELISPOT results was marginally associated with higher pH1N1-specific CD19+FOXP3+ and CD4+TGFβ+% Breg and Treg, respectively. In contrast, increases in HAI titers post-dose 1 were associated with significantly higher circulating CD19+CD25+% post-dose 1, whereas increases in IFNγ ELISPOT results post-dose 1 were associated with higher circulating CD4+/C8+CD25+FOXP3+%. In conclusion, in HIV-infected children and youth, influenza-specific Treg and Breg may contribute to poor responses to vaccination. However, robust humoral and CMI responses to vaccination may result in increased circulating Treg and/or Breg, establishing a feed-back mechanism.

Keywords: HIV infection; cell-mediated immunity; influenza vaccine; regulatory B cells; regulatory T cells.


Figures

None
Figure 1. pH1N1 IFNγ (A), GrB (B), PHA IFNγ (C), GrB (D) and Candida IFNγ (E) ELISPOT responses to two double-doses of pH1N1 vaccine. PBMC, frozen and thawed to preserve viability, were rested overnight. ELISPOT assays were performed only on PBMC with viability ≥ 70% immediately after thawing and after resting. The assays used MabTech kits, live pH1N1 viral infection to promote stimulation of both CD4+ and CD8+ T cells, PHA mitogen and candida antigen controls. Results are presented as medians and IQRs. The number of subjects that contributed data at each time point are indicated on the graphs. Statistically significant differences assessed by Wilcoxon Matched Paired Signed Ranks test are shown on the graphs.
None
Figure 2. Correlations of pH1N1 IFNγ ELISPOT results with pHN1 at baseline (A), post dose 1 (B) and post dose 2 (C). Data were derived from 67, 67 and 63 subjects in panels A, B and C, respectively. PBMC, frozen and thawed to preserve viability, were rested overnight. ELISPOT assays were performed only on PBMC with viability ≥ 70% both immediately after thawing and after resting. The assays used MabTech kits and live pH1N1 viral infection to promote stimulation of both CD4+ and CD8+ T cells. HAI titers were measured using pH1N1 antigens. Assays are described in detail in the methods section. The coefficients of correlation and p values shown on each graph were calculated using Spearman correlation test.
None
Figure 3. Kinetics of circulating CD4+CD25+ (B) and CD4+FOXP3+ (C) T cells after the two double-doses of pH1N1 vaccine. PBMC, frozen and thawed using procedures that preserve viability, were stained with mAbs anti-CD3, CD8, CD19, CD25 and FOXP3 and IL10 as described in the methods section. Panel A shows the gating strategy: (1) lymphocytes were identified by forward/side scatter; (2) CD4+ T cells were gated by expression of CD3 (CD3+) and lack of expression of CD8 (CD8-); (3) CD25+ and FOXP3+ CD4+ T cells were gated as shown. IL10 expression was gated using FOXP3 on one axis and IL10 on the other axis (not shown). CD8+ T cells were gated using expression of CD3 and CD8. B cells were gated as CD3-CD19+ (not shown). CD8+ T-cell and B-cell expression of CD25, FOXP3 and IL10 (not shown) were gated as described for CD4+ T cells. Panels B and C show only the lymphocyte subsets with significant changes over time. Results are presented as medians and IQRs. The number of subjects that contributed data at each time point are indicated on the graphs. Statistically significant differences assessed by Wilcoxon Matched Paired Signed Ranks test are shown on the graphs in panels B and C.
None
Figure 4. Kinetics of pH1N1-stimulated CD8+FOXP3+ (A) and CD8+TGFβ+ (B) T cells after the two double-doses of pH1N1vaccine. PBMC with viability ≥ 70% were incubated for 48h with medium control and with live pH1N1 virus to promote stimulation through both MHC class I and class II. After incubation cells were stained with mAb anti-CD3, CD8, CD19, CD25, FOXP3 and IL10. Companion tubes were also stained with mAb anti-CD3, CD8, IL2, TNFα, MIP1β and TGFβ. The gating strategy (not shown) was similar to that described for freshly thawed, unstimulated PBMC (Fig. 3). The number of subjects that contributed data at each time point are indicated on the graphs. Results, depicted as medians and IQRs, are shown only for the lymphocyte populations with significant changes over time. Statistically significant differences assessed by Wilcoxon Matched Paired Signed Ranks test are shown on the graphs.
None
Figure 5. Correlations of pH1N1-stimulated IFNγ ELISPOT results after the first immunization with CD19+FOXP3+ % Breg (A) and CD4+TGFβ+% Treg (B) after the first immunization. Data were derived from 63 and 66 participants in panels A and B, respectively. PBMC, frozen and thawed to preserve viability, were rested overnight. ELISPOT assays were performed only on PBMC with viability ≥ 70% immediately after thawing and after resting. The assays used MabTech kits and live pH1N1 viral infection to promote stimulation of both CD4+ and CD8+ T cells. Flow cytometric assays were also performed on PBMC with viability ≥ 70%. Cells were incubated with pH1N1 live virus or medium control for 48h after which they were stained as described in the methods section. The x axes represent the difference between baseline and post-dose 1 IFNγ ELISPOT results. The coefficients of correlation and p values shown on each graph were calculated using Spearman correlation test.
None
Figure 6. Correlations of pH1N1 antibody titers and of IFNγ ELISPOT results with circulating CD19+CD25+% B cells, CD4+CD25+FOXP3+% and CD8+CD25+FOXP3+% Treg after the first immunization. Data were derived from 72, 66 and 66 participants in panels A­−C, respectively. The x axes represent the difference between baseline and post-dose 1 pH1N1 HAI (A) or IFNγ ELISPOT (B and C). HAI antibody titers to pH1N1 were measured as described in the methods section. PBMC, frozen and thawed to preserve viability, were rested overnight. ELISPOT assays were performed only on PBMC with viability ≥ 70% both immediately after thawing and after resting. The assays used MabTech kits and live pH1N1 viral infection to promote stimulation of both CD4+ and CD8+ T cells. For flow cytometric analysis of circulating B and T cells, freshly thawed PBMC with adequate viability were stained with mAbs anti-CD3, CD8, CD19, CD25 and FOXP3 and IL10 as described in the methods section. The graphs depict only the correlations that reached statistical significance using the Spearman correlation test. Correlation coefficients and p values are shown on the graph.

References

    1. Levin MJ, Song LY, Fenton T, Nachman S, Patterson J, Walker R, et al. Shedding of live vaccine virus, comparative safety, and influenza-specific antibody responses after administration of live attenuated and inactivated trivalent influenza vaccines to HIV-infected children. Vaccine. 2008;26:4210–7. doi: 10.1016/j.vaccine.2008.05.054. - DOI - PMC - PubMed
    1. Malaspina A, Moir S, Orsega SM, Vasquez J, Miller NJ, Donoghue ET, et al. Compromised B cell responses to influenza vaccination in HIV-infected individuals. J Infect Dis. 2005;191:1442–50. doi: 10.1086/429298. - DOI - PubMed
    1. Cooper C, Thorne A, Klein M, Conway B, Boivin G, Haase D, et al. CIHR Canadian HIV Trials Network Influenza Vaccine Research Group Immunogenicity is not improved by increased antigen dose or booster dosing of seasonal influenza vaccine in a randomized trial of HIV infected adults. PLoS One. 2011;6:e17758. doi: 10.1371/journal.pone.0017758. - DOI - PMC - PubMed
    1. Crum-Cianflone NF, Eberly LE, Duplessis C, Maguire J, Ganesan A, Faix D, et al. Immunogenicity of a monovalent 2009 influenza A (H1N1) vaccine in an immunocompromised population: a prospective study comparing HIV-infected adults with HIV-uninfected adults. Clin Infect Dis. 2011;52:138–46. doi: 10.1093/cid/ciq019. - DOI - PMC - PubMed
    1. Kosalaraksa P, Srirompotong U, Newman RW, Lumbiganon P, Wood JM. Serological response to trivalent inactive influenza vaccine in HIV-infected children with different immunologic status. Vaccine. 2011;29:3055–60. doi: 10.1016/j.vaccine.2011.01.091. - DOI - PubMed

Publication types