

The table 2 fallacy: presenting and interpreting confounder and modifier coefficients
- PMID: 23371353
- PMCID: PMC3626058
- DOI: 10.1093/aje/kws412
The table 2 fallacy: presenting and interpreting confounder and modifier coefficients
Abstract
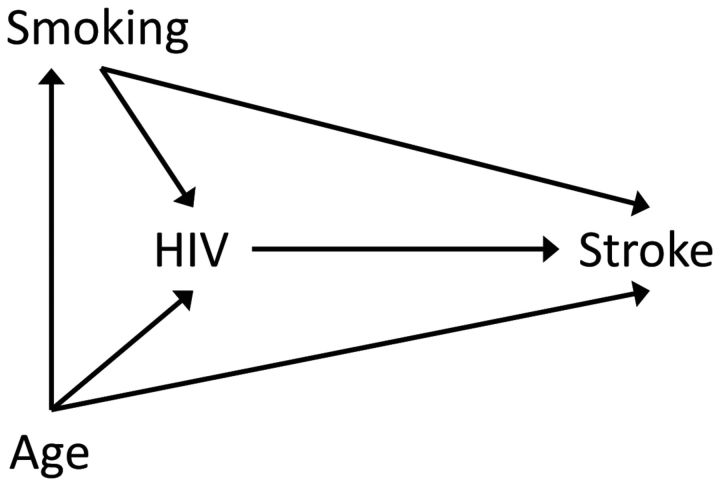
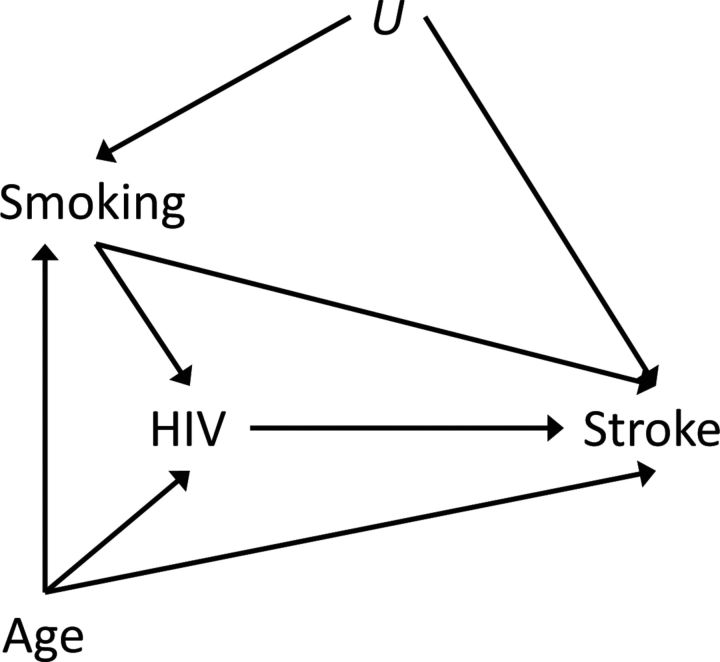
It is common to present multiple adjusted effect estimates from a single model in a single table. For example, a table might show odds ratios for one or more exposures and also for several confounders from a single logistic regression. This can lead to mistaken interpretations of these estimates. We use causal diagrams to display the sources of the problems. Presentation of exposure and confounder effect estimates from a single model may lead to several interpretative difficulties, inviting confusion of direct-effect estimates with total-effect estimates for covariates in the model. These effect estimates may also be confounded even though the effect estimate for the main exposure is not confounded. Interpretation of these effect estimates is further complicated by heterogeneity (variation, modification) of the exposure effect measure across covariate levels. We offer suggestions to limit potential misunderstandings when multiple effect estimates are presented, including precise distinction between total and direct effect measures from a single model, and use of multiple models tailored to yield total-effect estimates for covariates.
Figures
References
-
- Robins JM, Greenland S. Identifiability and exchangeability for direct and indirect effects. Epidemiology. 1992;3(2):143–155. - PubMed
-
- Cole SR, Hernan MA. Fallibility in estimating direct effects. Int J Epidemiol. 2002;31(1):163–165. - PubMed
-
- Glymour MM, Greenland S., Rothman KJ, Greenland S, Lash TL. Modern Epidemiology. 3rd ed. Philadelphia, PA: Lippincott Williams & Wilkins; 2008. Causal diagrams; pp. 183–209.
Publication types
MeSH terms
Grants and funding
LinkOut - more resources
Full Text Sources
Other Literature Sources
Medical
