. 2013 Jan;25(1):149-66.
doi: 10.1105/tpc.112.108191. Epub 2013 Jan 31.

Arabidopsis paired amphipathic helix proteins SNL1 and SNL2 redundantly regulate primary seed dormancy via abscisic acid-ethylene antagonism mediated by histone deacetylation

Affiliations

Arabidopsis paired amphipathic helix proteins SNL1 and SNL2 redundantly regulate primary seed dormancy via abscisic acid-ethylene antagonism mediated by histone deacetylation

Zhi Wang et al. Plant Cell. 2013 Jan.

Abstract

Histone (de)acetylation is a highly conserved chromatin modification that is vital for development and growth. In this study, we identified a role in seed dormancy for two members of the histone deacetylation complex in Arabidopsis thaliana, SIN3-LIKE1 (SNL1) and SNL2. The double mutant snl1 snl2 shows reduced dormancy and hypersensitivity to the histone deacetylase inhibitors trichostatin A and diallyl disulfide compared with the wild type. SNL1 interacts with HISTONE DEACETYLASE19 in vitro and in planta, and loss-of-function mutants of SNL1 and SNL2 show increased acetylation levels of histone 3 lysine 9/18 (H3K9/18) and H3K14. Moreover, SNL1 and SNL2 regulate key genes involved in the ethylene and abscisic acid (ABA) pathways by decreasing their histone acetylation levels. Taken together, we showed that SNL1 and SNL2 regulate seed dormancy by mediating the ABA-ethylene antagonism in Arabidopsis. SNL1 and SNL2 could represent a cross-link point of the ABA and ethylene pathways in the regulation of seed dormancy.


Figures

Figure 1.
Figure 1.
Expression Patterns of SNL1 and SNL2. (A) qRT-PCR analysis of SNL1 and SNL2 expression in Arabidopsis tissues. Results were normalized against the expression of ACTIN8. The mean values and se were from three independent experiments. A representative result of gel electrophoresis is displayed at the bottom. (B) qRT-PCR analysis of SNL1 (gray) and SNL2 (white) in developing siliques. The x axis presents the developmental stage after pollination. The mean values and se were from three independent experiments. MS, mature seed. A representative result of gel electrophoresis is displayed at the bottom.
Figure 2.
Figure 2.
The Seed Dormancy Phenotype of SNL1 and SNL2 T-DNA Insertion Lines. (A) Schematic diagrams of the SNL1 and SNL2 gene structures with the positions of the T-DNA insertions. Exons are shown as black boxes and introns and 5′ untranslated region as lines and dashed lines, respectively. The positions of the primers used for RT-PCR analysis in (B) are indicated next to the structures. (B) RT-PCR analysis of the SNL1 and SNL2 transcripts in leaves of wild-type and T-DNA insertion mutants. Total RNA was extracted from 10-d-old fresh leaves and reverse transcribed to single-stranded cDNA. The primers for RT-PCR are indicated in (A) and listed in Supplemental Table 1 online. ACTIN8 was used as a loading control. (C) Seed germination phenotypes of Col (the wild type), snl1, snl2-1, snl2-2, and the snl1 snl2-1 double mutant on water in the light after different periods of after-ripening. Percentages of seed germination are means (±se) based on at least eight individual plants for each genotype. (D) Complementation of snl1. Seed germination of Col, snl1, and two homozygous transgenic lines (2-6 and 3-2) containing a P35S:SNL1 construct. Percentages of seed germination are means (±se) based on at least eight individual plants for each genotype. (E) Seed survival of Col and the snl1, snl2-1, and snl1 snl2-1 mutants after dry storage for 90 and 180 d. The seeds were harvested under identical conditions and stored at 25°C in a controlled chamber with 16-h/8-h light/dark. This experiment was repeated three times with independent samples, and a representative result is shown. Percentages of seed germination are means (±se) based on at least eight individual plants for each genotype.
Figure 3.
Figure 3.
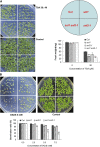
snl Mutants Response to the HDAC Inhibitors TSA and DADS. (A) The postgermination growth of Col and mutants in response to TSA after 17 d growth in a chamber with 16 h light at 22°C. The left photographs show Col and mutants in MS with (top) or without TSA (bottom). The diagram on the right shows the positions of the different lines on the plates. The graph shows fresh weight of Col and mutants growing on the plate. At least three independent experiments were performed, similar results were obtained, and representative data are displayed. Error bars denote sd (n > 30), and single asterisk and double asterisk indicate significant differences from Col by Student’s t test (P < 0.05 and P < 0.01, respectively). (B) Seed germination phenotype of Col and mutants in response to DADS after 12 d of growth. The photograph shows the germination of Col and mutants in MS with (left) or without DADS (right); the positions of different lines in the plate are the same as in (A). The graph shows the seed germination percentage of each genotype in the plates. Three independent experiments were performed, similar results were obtained, and representative data are displayed. Error bars denote sd (n > 6), and single and double asterisks indicate significant difference between Col and snl mutants by Student’s t test (P < 0.05 and P < 0.01, respectively).
Figure 4.
Figure 4.
Histone Acetylation Status in snl Mutants. H3 and H4 Lys acetylation levels in Col, snl1, snl2-1, and snl1 snl2-1 were determined by immunoblot with the specific antibodies indicated on the right. Immunoblot signals with H3 antibody are shown as loading control. The histone proteins were extracted from 7-d-old seedlings of different lines.
Figure 5.
Figure 5.
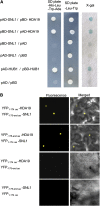
SNL1 Physically Interacts with HDA19. (A) Yeast two-hybrid analysis of the interaction between SNL1 and HDA19. All transformants were cultured in selective medium lacking Leu and Trp (control) or Leu, Trp, His, and Ade. As an additional indicator of interaction, colonies were monitored for LacZ activity (blue color with X-Gal) using a filter lift assay. Self-interaction of HUB1 (Cao et al., 2008) was used as a positive control (pAD-HUB1/ pBD-HUB1). Cotransformation of pAD-SNL1 and pBD-SNL1 with empty pAD or pBD vectors is shown as negative control. (B) BiFC of the interaction between SNL1 and HDA19 in N. benthamiana leaf epidermal cells. Top panel shows the signal from enhanced YFP, reconstituted from YFP1-174 aa-HDA19 and YFP-175-end aa-SNL1, and transmitted light detector signals. Second panel includes enhanced YFP, reconstituted from YFP1-174 aa-SNL1 and YFP-175-end aa-HDA19, and transmitted light detector signals. The bottom two panels show that no fluorescence signal was observed with cotransformants of constructs YFP1-174 aa-HDA19 and YFP-175-end aa or YFP-175-end aa-SNL1 and YFP1-174 aa.
Figure 6.
Figure 6.
Transcriptome Analysis of snl1 snl2-1 12-h Imbibed Freshly Harvested Seeds. TAGGIT gene ontology classification of up- and downregulated genes in the snl1 snl2-1 double mutant. The data consist of genes that have a fold change ≥ 1.5 (log2 ratio ≥ 0.6) and an FDR value ≤ 0.05 from two independent RNA-seq experiments. The complete list is presented in Supplemental Data Set 1 online.
Figure 7.
Figure 7.
SNL1 and SNL2 Negatively Regulate Ethylene Signaling in Seed Germination of Arabidopsis. (A) Expression pattern of genes involved in ethylene synthesis and signal transduction in Col and snl mutants. Expression levels were analyzed using qRT-PCR and normalized using the ACTIN8 as an internal control. Each experiment had three biological replicates, and the average value is shown with se. The relative level in Col was set at 1. Total RNA was extracted from 12-h imbibed freshly harvested seeds. (B) The ethylene production of freshly harvested seeds from Col and snl mutants was determined by gas chromatography. Three independent experiments were performed, and the average value is shown with se. The single and double asterisks indicate significant difference from Col by Student’s t test (P < 0.05 and P < 0.01, respectively). (C) Ethylene responses of Col and mutants. The photos show a representative result of 3-d-old seedlings in the dark in MS medium without (top) and with (bottom) 1 μM ACC. The mutants snl1, snl2-1, and snl1 snl2-1 are ethylene sensitive to different extents. Bars = 1 mm. (D) Hypocotyl growth in response to 1 μM ACC. The hypocotyl lengths of different lines were measured after 3 d in dark. The average value is shown with sd (n = 15). (E) Germination rates of Col and mutants etr1-2, snl1 snl2-1, and snl1 snl2-1 etr1-2. The triple mutant snl1 snl2-1 etr1-2 was obtained and identified by crossing homozygous etr1-2 and snl1 snl2-1. The average value is shown with se (n ≥ 8).
Figure 8.
Figure 8.
SNL1 and SNL2 Positively Regulate ABA Signaling in Seed Dormancy of Arabidopsis. (A) Germination rates of Col, snl1, snl2-1, and snl1 snl2-1 in response to ABA. Percentages of seed germination are means (±sd) based on eight individual plants. The seeds were immersed in different solutions (including control) at 4°C for 3 d; then, germination percentages were counted after 7 d in a growth chamber at 22°C with 16 h of light and 8 h of darkness. (B) ABA contents in freshly harvested seeds of mutants and Col. ABA levels were measured by HPLC. Error bars denote sd from two independent samples. FW, fresh weight. (C) Expression patterns of genes involved in the ABA pathway. Total RNA was extracted from 12-h imbibed Col and mutant seeds. The mean values and se were from three biological replicates and normalized using ACTIN8 as an internal control. The relative expression level in Col was set at one. (D) Expression patterns of SNL1 and SNL2 in response to ABA. Expression levels were measured using qRT-PCR. Total RNA was extracted from Col seeds imbibed for 12 h in different ABA concentrations (0.1, 1, and 10 μM). The mean values and se were from three biological replicates.
Figure 9.
Figure 9.
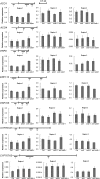
ChIP Assay of Upregulated Key Genes Involved in the Ethylene and ABA Pathways in snl Mutants. A schematic diagram of each gene structure is shown in the top. Dashed lines indicate the ∼500-bp promoter sequence. The amplification sites for ChIP analysis are indicated as numbers (1 to 3) with black lines below the draft. Black lines represent the ORF of the gene from start codon to stop codon. The figures show the accumulated abundance of each gene with specific primers for different regions (regions 1, 2, and 3) in the ChIP assay. Immunoprecipitates were obtained from 7-d-old seedlings with an H3K9/18ac-specific antibody (Upstate 07-593). Relative amounts of the PCR products were calculated and normalized to ACTIN8. This experiment was repeated three times with independent samples.
Figure 10.
Figure 10.
SNL1 and HUB1 Additively Affect Seed Dormancy. The double mutant snl1 hub1-5 was obtained by crossing the snl1 and hub1-5 mutants. The null mutation of hub1-5 was identified as before (Liu et al., 2007). Percentages of seed germination (±se) are based on at least eight individual plants for each line.
Figure 11.
Figure 11.
A Model Depicting the Role of SNL1 and SNL2 in Seed Dormancy. During seed dormancy establishment, SNL1 and SNL2 regulate histone acetylation levels at the genes that are involved in the ABA and ethylene pathways. Histone deacetylation mediated by SNL1 and SNL2 negatively regulates the ethylene pathway and positively regulates the ABA pathway, which leads to an increase in seed dormancy mediated by the antagonism between the ABA and ethylene pathways.

Similar articles

Cited by

References

    1. Alonso-Blanco C., Bentsink L., Hanhart C.J., Blankestijn-de Vries H., Koornneef M. (2003). Analysis of natural allelic variation at seed dormancy loci of Arabidopsis thaliana. Genetics 164: 711–729 - PMC - PubMed
    1. Audic S., Claverie J.M. (1997). The significance of digital gene expression profiles. Genome Res. 7: 986–995 - PubMed
    1. Beaudoin N., Serizet C., Gosti F., Giraudat J. (2000). Interactions between abscisic acid and ethylene signaling cascades. Plant Cell 12: 1103–1115 - PMC - PubMed
    1. Bentsink L., Jowett J., Hanhart C.J., Koornneef M. (2006). Cloning of DOG1, a quantitative trait locus controlling seed dormancy in Arabidopsis. Proc. Natl. Acad. Sci. USA 103: 17042–17047 - PMC - PubMed
    1. Bewley J.D. (1997). Seed germination and dormancy. Plant Cell 9: 1055–1066 - PMC - PubMed

Publication types

MeSH terms

LinkOut - more resources