. 2013 Jan;25(1):57-70.
doi: 10.1105/tpc.112.105890. Epub 2013 Jan 31.

A developmental framework for complex plasmodesmata formation revealed by large-scale imaging of the Arabidopsis leaf epidermis

Affiliations

A developmental framework for complex plasmodesmata formation revealed by large-scale imaging of the Arabidopsis leaf epidermis

Jessica Fitzgibbon et al. Plant Cell. 2013 Jan.

Abstract

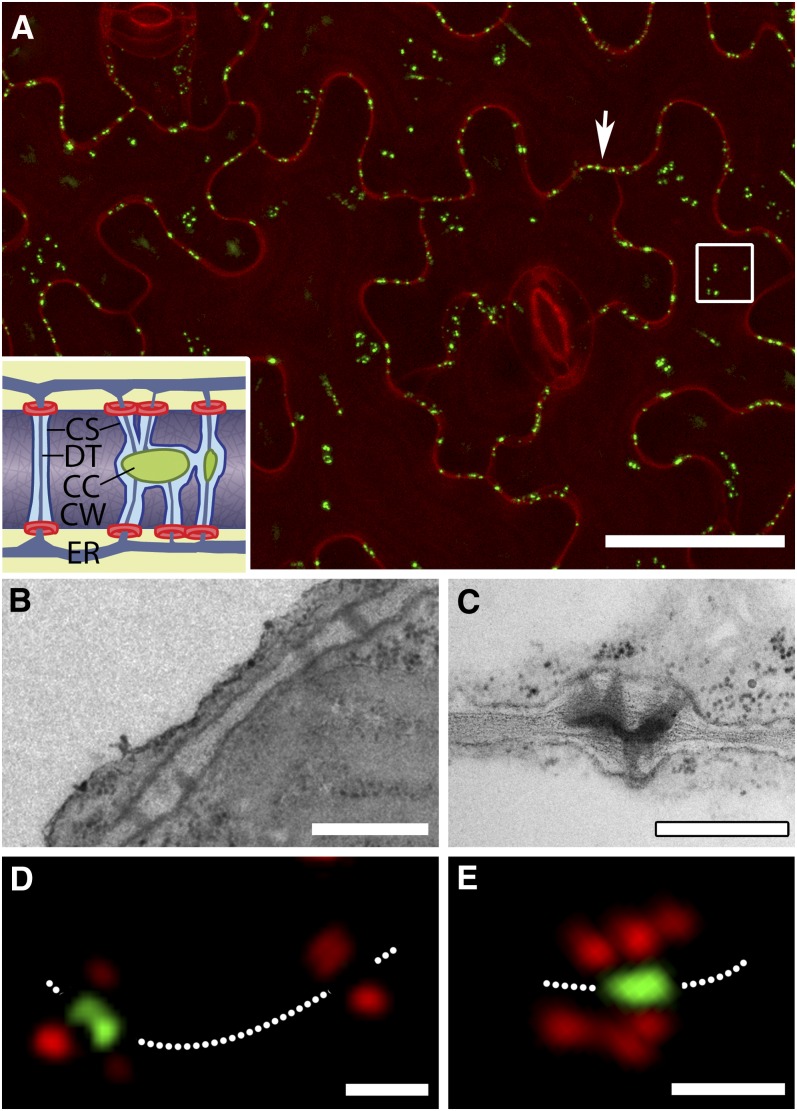
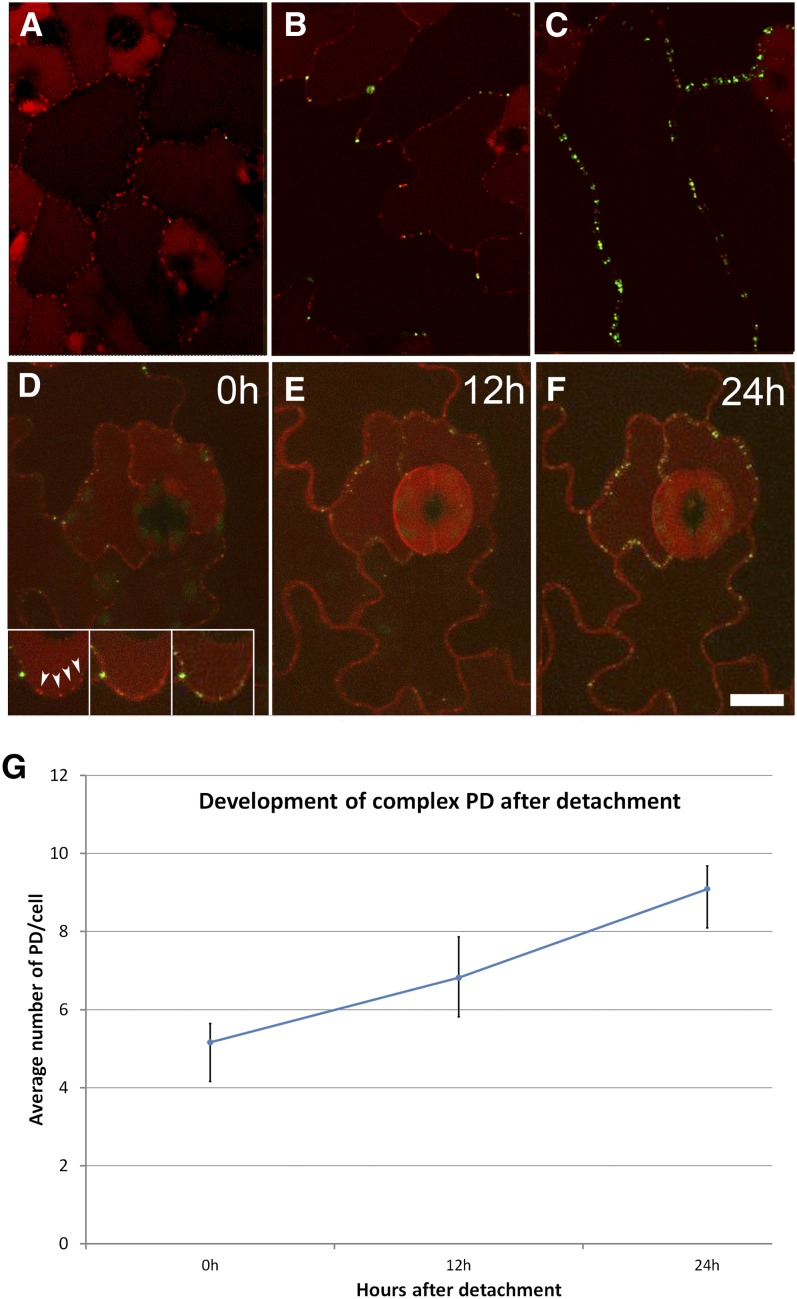
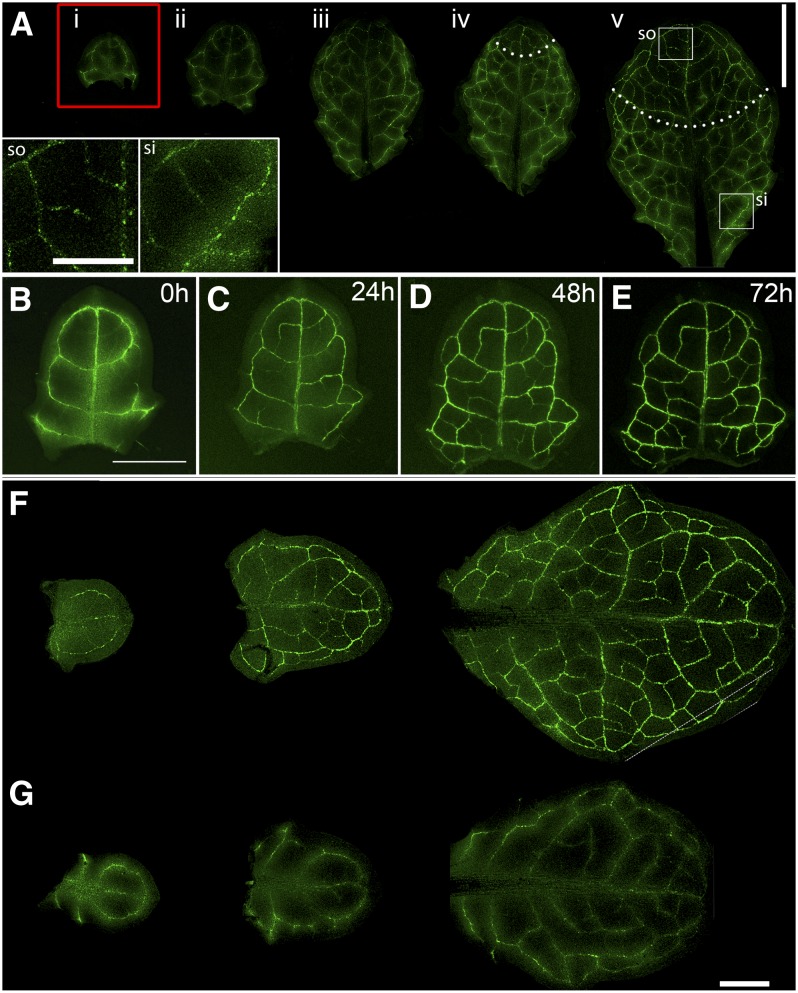
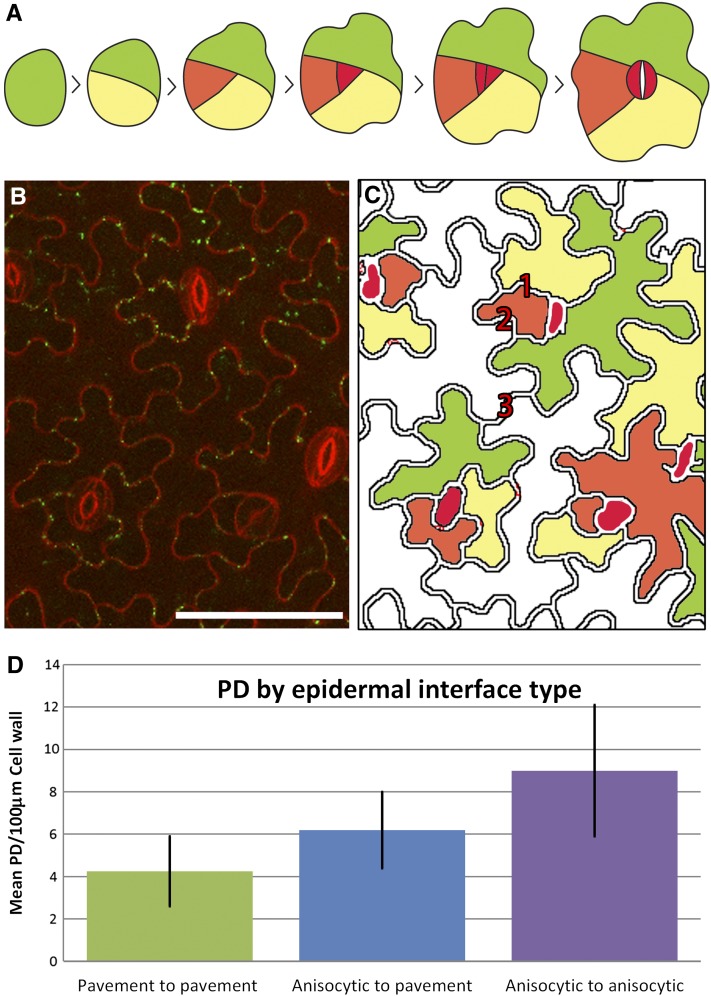
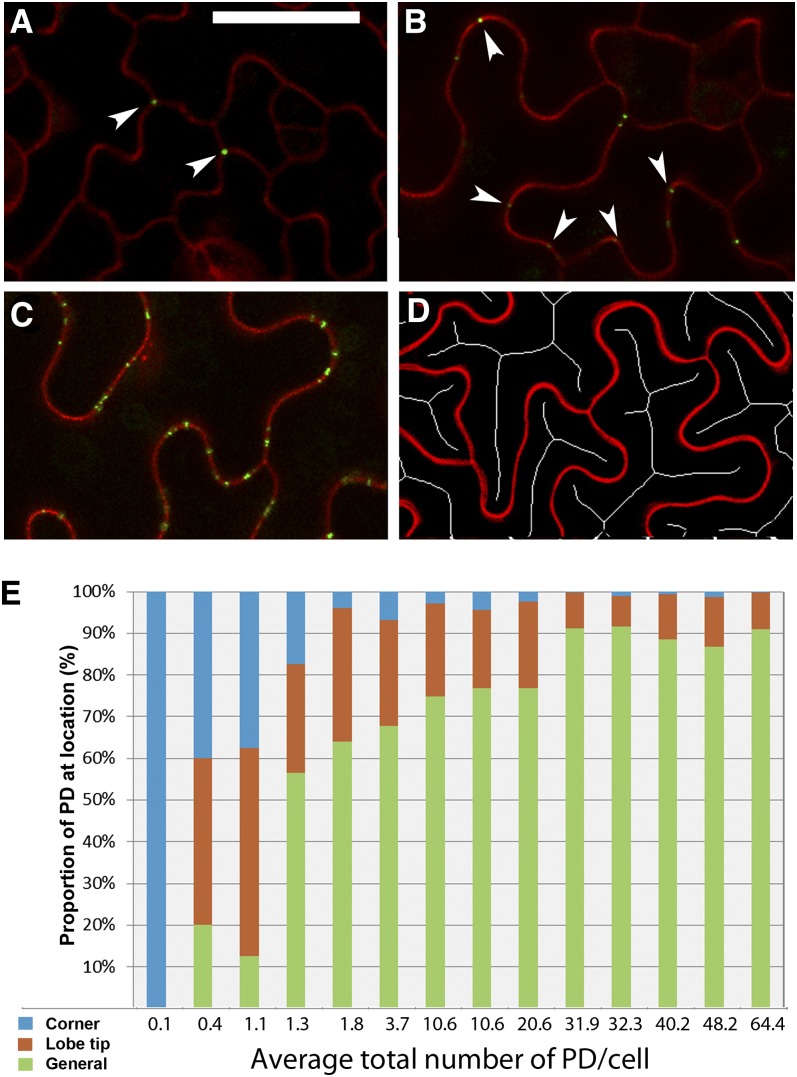
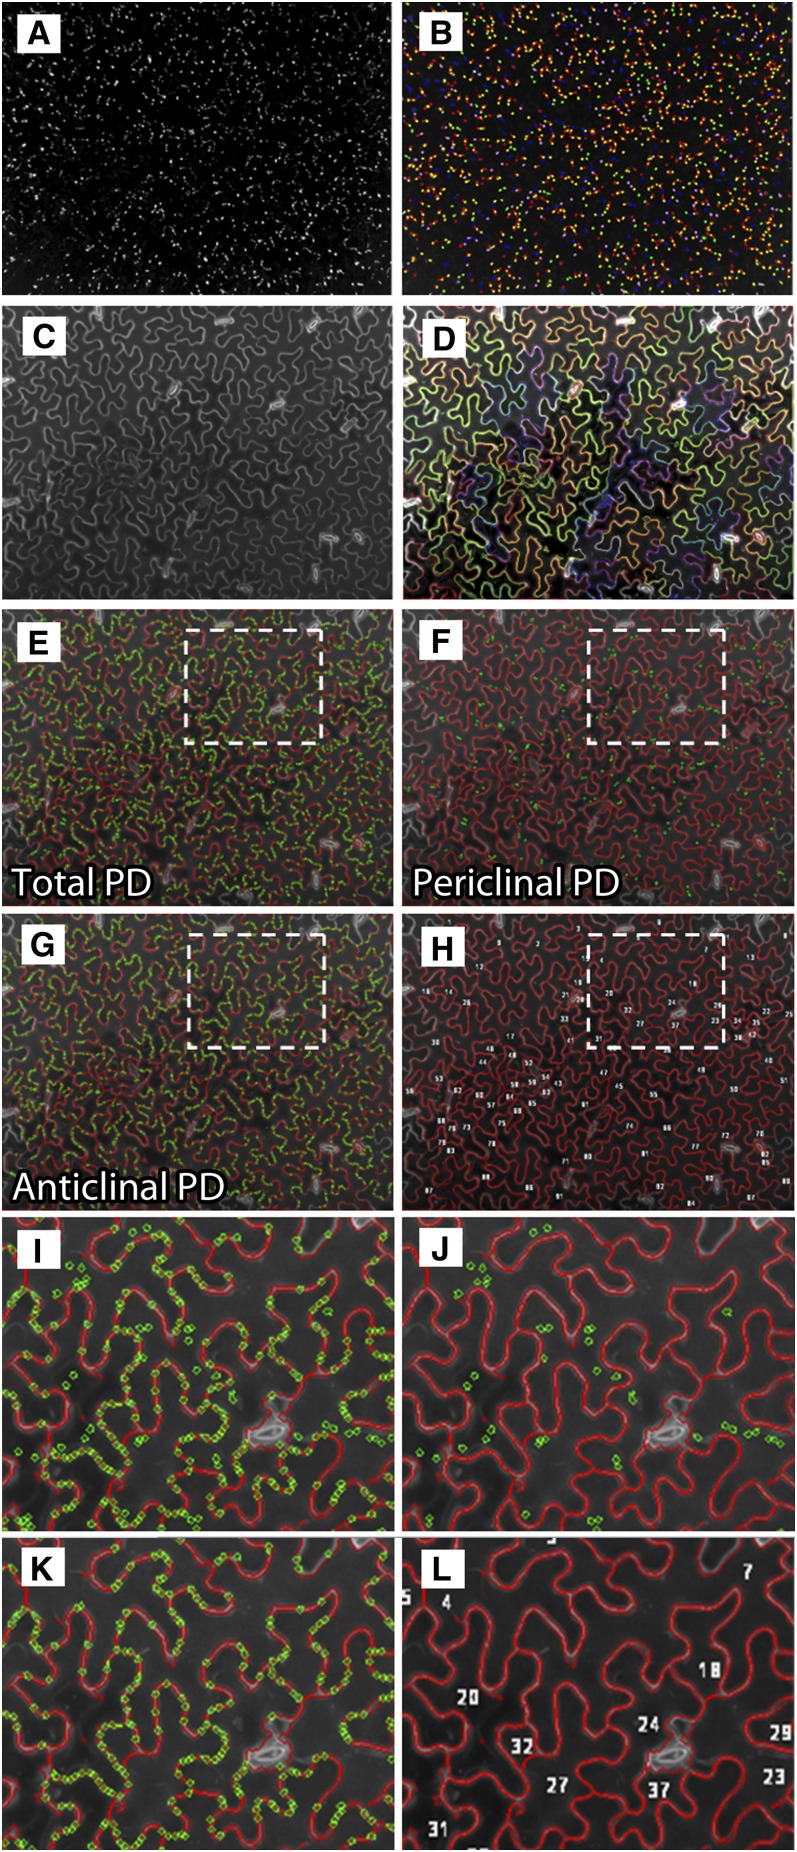
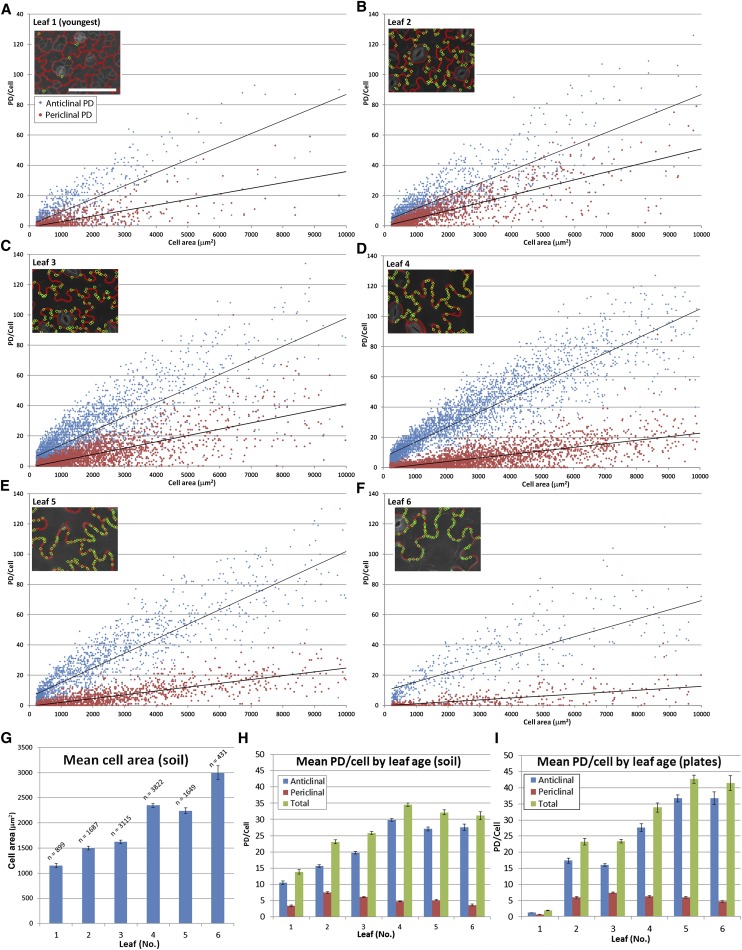
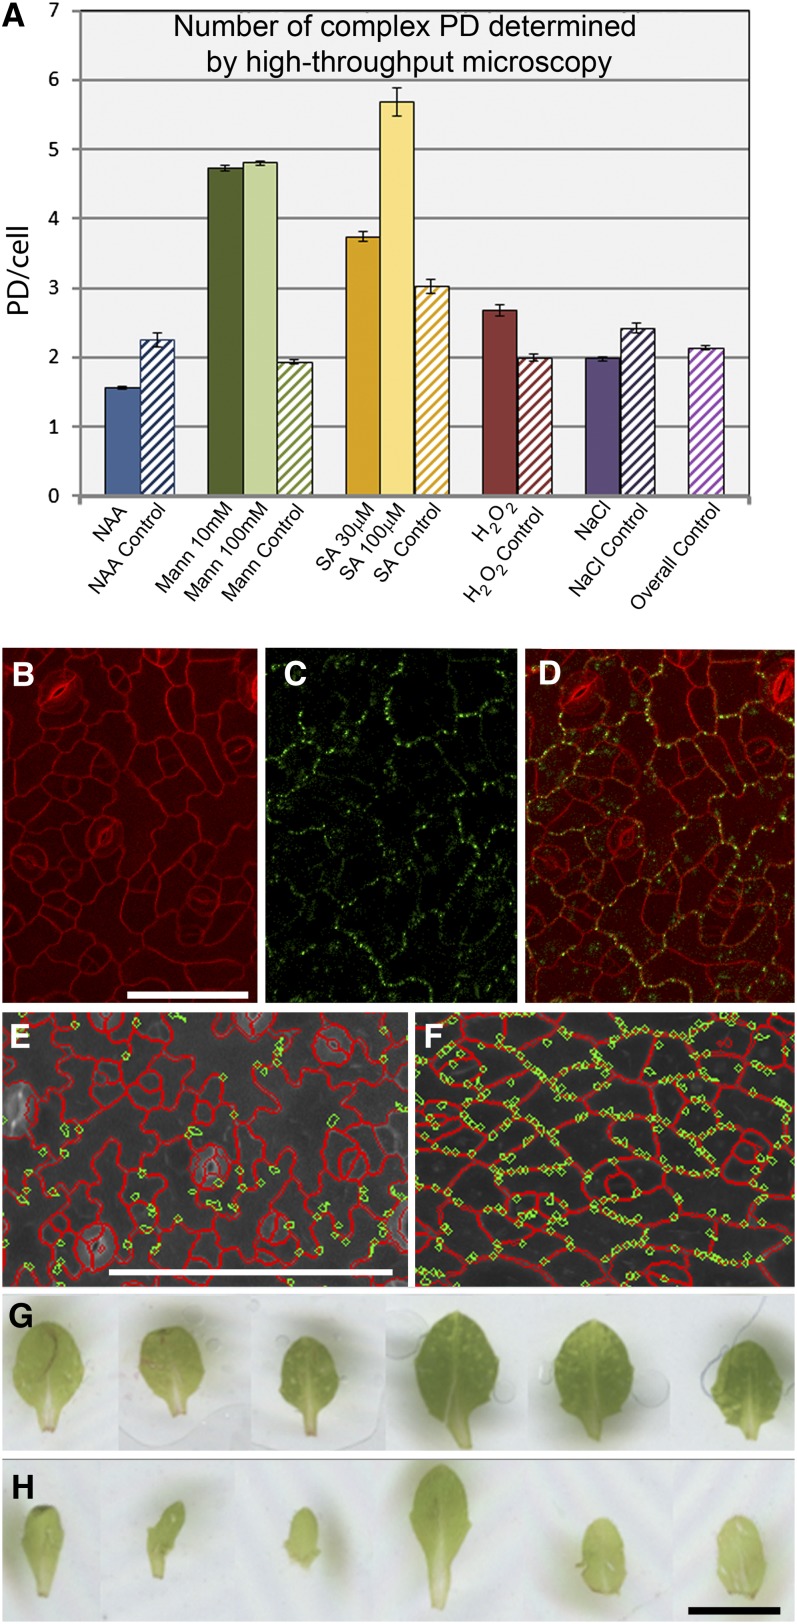
Plasmodesmata (PD) form tubular connections that function as intercellular communication channels. They are essential for transporting nutrients and for coordinating development. During cytokinesis, simple PDs are inserted into the developing cell plate, while during wall extension, more complex (branched) forms of PD are laid down. We show that complex PDs are derived from existing simple PDs in a pattern that is accelerated when leaves undergo the sink-source transition. Complex PDs are inserted initially at the three-way junctions between epidermal cells but develop most rapidly in the anisocytic complexes around stomata. For a quantitative analysis of complex PD formation, we established a high-throughput imaging platform and constructed PDQUANT, a custom algorithm that detected cell boundaries and PD numbers in different wall faces. For anticlinal walls, the number of complex PDs increased with increasing cell size, while for periclinal walls, the number of PDs decreased. Complex PD insertion was accelerated by up to threefold in response to salicylic acid treatment and challenges with mannitol. In a single 30-min run, we could derive data for up to 11k PDs from 3k epidermal cells. This facile approach opens the door to a large-scale analysis of the endogenous and exogenous factors that influence PD formation.


Figures

Figure 1.
Figure 1.
Leaf Epidermal PDs Viewed by Confocal and Super-Resolution Microscopy. (A) Surface view of the epidermis stained with propidium iodide reveals PDs labeled by MP17-GFP in both anticlinal (arrow) and periclinal (boxed region) interfaces. The inset shows a diagram of simple (left) and complex (right) PDs, showing the location of MP17 (green) in the central cavity of complex PDs. Callose collars are shown in red. CC, central cavity; CS, cytoplasmic sleeve; CW, cell wall; DT, desmotubule; ER, endoplasmic reticulum. Bar = 30 μm. (B) Image of simple PDs in the cell wall connecting epidermal cells in a region of leaf not labeled with MP17-GFP. Bar = 0.5 μm. (C) Image of a complex PDs from a region of leaf expressing MP17-GFP. Note that multiple branches lead into a shared central cavity. Bar = 0.5 μm. (D) and (E) Super-resolution images of PDs acquired using three-dimensional structured illumination microscopy. MP17 is associated exclusively with central cavities of complex PDs, identified by callose collars (red). A simple PD with two callose collars (right in [D]) shows no labeling in the central region of the pore. In (E), several callose collars surround a single shared central cavity. The dotted line depicts the orientation of the cell wall. Bars = 0.5 µm.
Figure 2.
Figure 2.
Dual Labeling of PDs with PDLP1-mRFP (All PDs) and MP17-GFP (Complex PDs Only) Allows Imaging of the Conversion of Simple to Complex PDs. (A) PDs at the base of leaf 1 show exclusively simple PDs (red). Vacuolar fluorescence is due to nonspecific accumulation of mRFP. (B) The first appearance of complex PDs (green) occurs at three-way junctions and epidermal lobes. (C) In older leaves, the PD signals become yellow as complex PDs supersede simple PDs in the epidermis. (D) to (F) Time-lapse imaging of an anisocytic complex over a 24-h period showing that complex PDs arise at sites occupied by existing simple PDs. The boxed region shows detail of an epidermal lobe in which simple PDs (red) are converted to complex PDs (yellow). Progression of complex PD numbers in epidermal cells in leaf 1 over a 24-h period following its detachment from the plant. Bar = 10 μm. (G) Increase in complex PD numbers following leaf detachment. Graph shows data averaged from a range of leaf ages and sizes.
Figure 3.
Figure 3.
Leaf Detachment Is Accompanied by an Accelerated Sink–Source Transition. (A) The sink–source transition on an intact plant is revealed using the At-SUC2 promoter to drive GFP expression. Leaves i to iii show diffuse vein labeling indicative of GFP unloading (Imlau et al., 1999; Wright et al., 2003). Leaves iv and v show the onset of loading in the apical part of leaf, indicated by restriction of GFP to the companion cells (areas above dotted lines). The insets show the source (so) and sink (si) regions of leaf (v). Bar = 2 cm. (B) to (E) Accelerated sink–source transition in leaf i after its detachment from the plant. Restriction of GFP to developing veins is seen after 24 h (C) and progresses as new veins mature ([D] and [E]). Bar = 0.5 cm. (F) and (G) Removal of all leaves on the plant except leaves i to iii also accelerates the sink–source transition. (F) Punctate vein labeling, indicative of phloem loading, is apparent in leaves i to iii when all other leaves are removed. (G) Control leaves from an untreated plant continue to show diffuse GFP labeling, indicative of phloem unloading (cf. [A], i to iii). Bar = 0.5 cm.
Figure 4.
Figure 4.
Appearance of Complex PDs in Anisocytic Complexes. (A) Asymmetric division of a single epidermal precursor (green) gives rise to two daughter cells, the smaller of which (yellow) undergoes further asymmetric division to give rise to a cell (orange) that will form the precursor of the meristemoid cell (red). Division of this cell gives rise to the guard cells. (B) Early appearance in the leaf epidermis of complex PDs (green) occurs in anisocytic complexes adjacent to guard cells. Bar = 50 μm. (C) Representation, based on (A), of the relative age of cells in the anisocytic complexes. (1) Anisocytic-anisocytic interface, (2) anisocytic-pavement interface, and (3) pavement-pavement interface. The oldest pavement epidermal cells are shown in white. (D) Densities of complex PDs associated with different interfaces of the anisocytic complex.
Figure 5.
Figure 5.
Progression of Complex PD Formation in Pavement Epidermal Cells. (A) The first complex PDs appear at the three-way junctions between epidermal cells (arrowheads). Bar = 20 μm for (A) to (C). (B) Subsequent PDs appear at the lobed tips of pavement epidermal cells (arrowheads). (C) With continued development of the epidermis, complex PDs appear in the intervening wall regions between lobes (general PD labeling). (D) Skeleton cell profiles, generated using ImageJ, are used to determine the positions of lobes. (E) Quantitative assessment of the appearance of complex PDs at three-way junctions, lobe tips, and general regions, respectively, as a function of increasing complex PD numbers in a sample of leaves.
Figure 6.
Figure 6.
The High-Throughput Analysis Workflow for Detecting PDs and Segmenting Jigsaw-Shaped Cells Using PDQUANT. (A) A maximum intensity projection was used to merge 21 to 35 optical Z planes (image sequences in the PD channel) into a two-dimensional pseudo-image for PD signals. (B) A set of PD candidates detected from PD images, which are presented by randomly colored circles. (C) A maximum intensity projection was used to merge 21 to 35 optical Z planes (image sequences in the cell channel) into a two-dimensional pseudo-image for cell boundary signals. (D) Jigsaw-shaped cells are segmented and cell boundaries are highlighted by colored lines. (E) Detected cell boundaries (colored red) are overlapped with recognized PDs (colored green). Cells with unsuitable size (<200 μm), contrast, and location (e.g., small cells attached to the image border) are discarded. (F) and (G) PDs overlaid with cell boundaries are categorized into the anticlinal (epidermal-epidermal) PD group, and those overlapped with cell interiors are categorized into the periclinal (epidermal-mesophyll) PD group. PDs not overlaid with any cells are discarded from the analysis. (H) Detected cells are treated as image objects. They are labeled together with calculated features, such as size, two-dimensional coordinates, and the number of PDs per cell. (I) to (L) High-magnification views of recognized cell boundaries showing all PDs (I), periclinal PDs (J), anticlinal PDs (K), and cell identities (L).
Figure 7.
Figure 7.
Large-Scale Analysis of the Insertion of Complex PDs in the Arabidopsis Leaf Epidermis Using PDQUANT. (A) to (F) Data for the first six emerged leaves. PD numbers and area for individual cells in both anticlinal (red) and periclinal (blue) epidermal walls are shown, with cells under 200 μm not analyzed. The insets show representative images from PDQUANT showing locations of individual complex PDs in the cell wall. (G) Data for mean cell area of the first six leaves. (H) Mean number of complex PDs at different epidermal interfaces for the first six leaves for plants grown on soil. (I) Mean number of PDs at different epidermal interfaces for the first six leaves for plants grown on agar.
Figure 8.
Figure 8.
Response of Complex PD Formation in Anticlinal Epidermal Interfaces to Exogenous Stresses. (A) Numbers of complex PDs, derived using PDQUANT, in leaf 2 of plants subjected to a range of treatments (mannitol, 10 and 100 mM; H2O2, 1 mM; NaCl, 25 mM; NAA, 50 nM; SA 30 and 100 μm) and their respective controls that were performed in parallel to the treatment experiments. The “overall control” shows the average from all of the parallel control experiments combined. Mannitol and SA treatments show a significant increase (P < 0.01) in complex PD numbers. (B) to (D) Appearance of epidermal cells from plants grown on mannitol. Lobing is absent in the pavement cells (B), and complex PDs (C) are restricted to the interfaces of the oldest epidermal cells. (D) shows the merged images. Bar = 50 μm. (E) to (F). PDQUANT images of control (E) and 100 mM mannitol treated (F) leaves, showing detected cells (red) and PD (green). Scale = 100 μm. (G) to (H) Mannitol treatment results in narrower leaves (G) compared to control plants (H). Scale = 2 mm.

References

    1. Bayer E., Thomas C., Maule A. (2008). Symplastic domains in the Arabidopsis shoot apical meristem correlate with PDLP1 expression patterns. Plant Signal. Behav. 3: 853–855 - PMC - PubMed
    1. Benitez-Alfonso Y., Cilia M., San Roman A., Thomas C., Maule A., Hearn S., Jackson D. (2009). Control of Arabidopsis meristem development by thioredoxin-dependent regulation of intercellular transport. Proc. Natl. Acad. Sci. USA 106: 3615–3620 - PMC - PubMed
    1. Burch-Smith T.M., Stonebloom S., Xu M., Zambryski P.C. (2011). Plasmodesmata during development: Re-examination of the importance of primary, secondary, and branched plasmodesmata structure versus function. Protoplasma 248: 61–74 - PMC - PubMed
    1. Burch-Smith T.M., Zambryski P.C. (2010). Loss of INCREASED SIZE EXCLUSION LIMIT (ISE)1 or ISE2 increases the formation of secondary plasmodesmata. Curr. Biol. 20: 989–993 - PMC - PubMed
    1. Burch-Smith T.M., Zambryski P.C. (2012). Plasmodesmata paradigm shift: Regulation from without versus within. Annu. Rev. Plant Biol. 63: 239–260 - PubMed

Publication types

MeSH terms

LinkOut - more resources