

Manganese supplementation protects against diet-induced diabetes in wild type mice by enhancing insulin secretion
- PMID: 23372018
- PMCID: PMC3578995
- DOI: 10.1210/en.2012-1445
Manganese supplementation protects against diet-induced diabetes in wild type mice by enhancing insulin secretion
Abstract
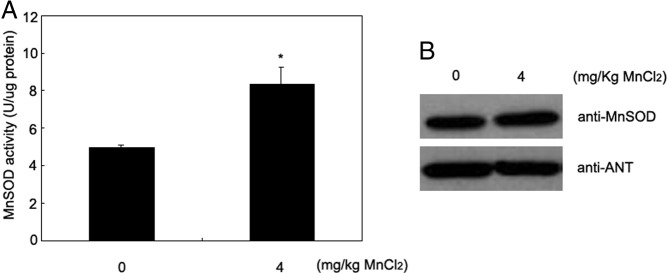
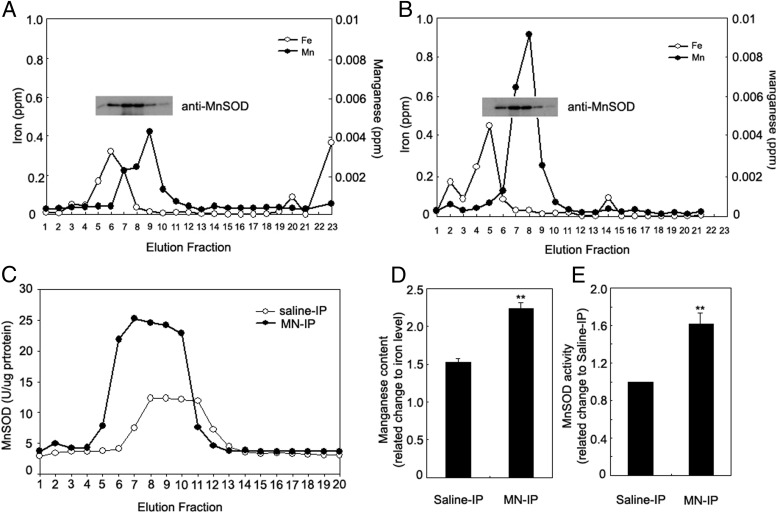
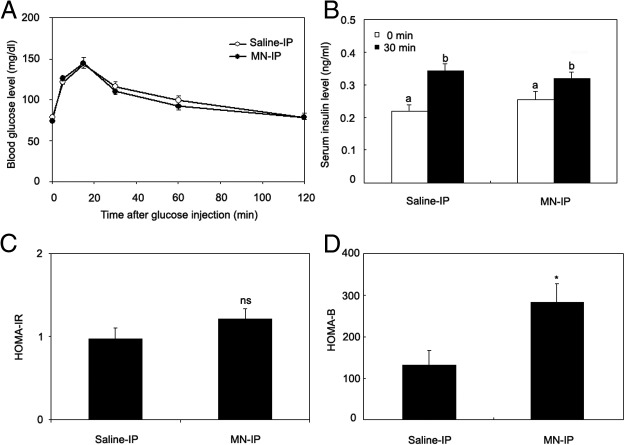
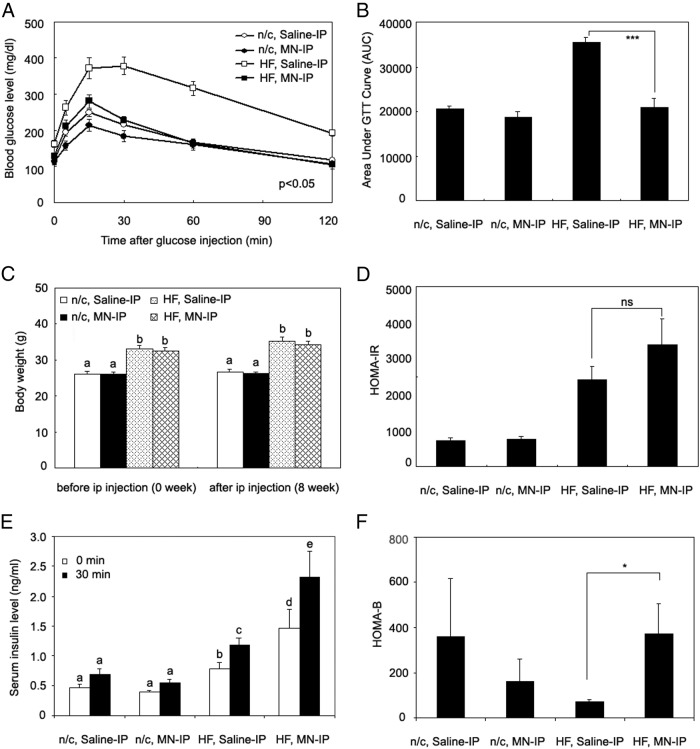
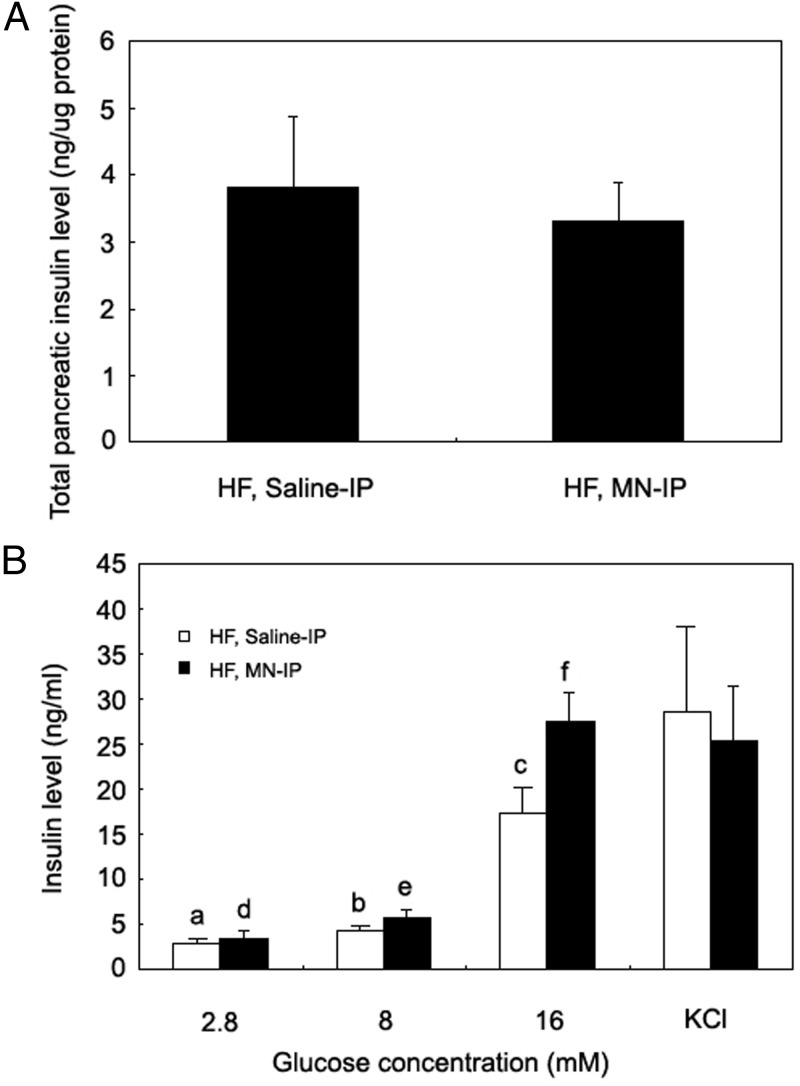
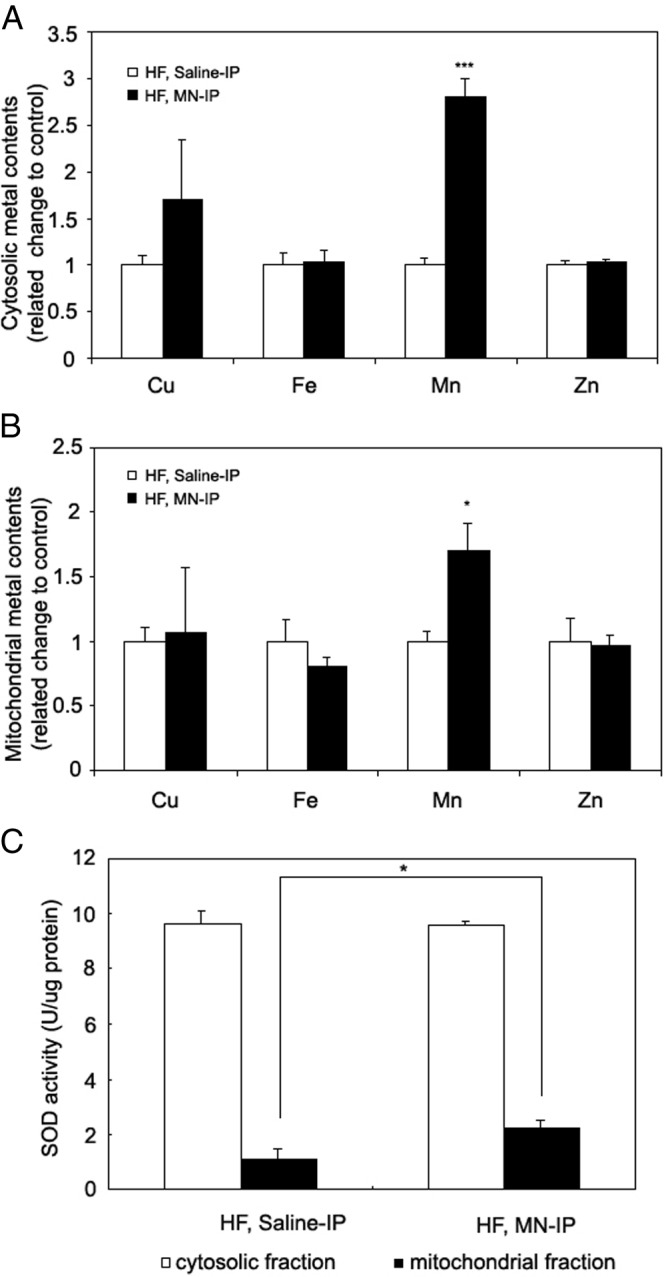
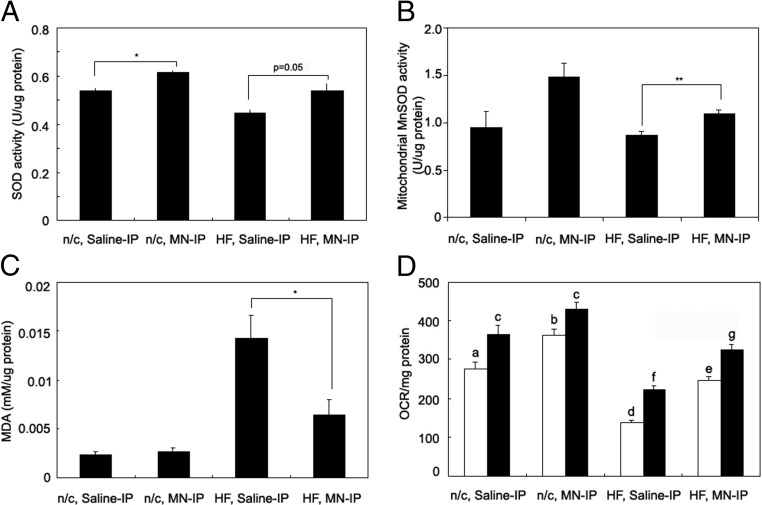
Mitochondrial dysfunction is both a contributing mechanism and complication of diabetes, and oxidative stress contributes to that dysfunction. Mitochondrial manganese-superoxide dismutase (MnSOD) is a metalloenzyme that provides antioxidant protection. We have previously shown in a mouse model of hereditary iron overload that cytosolic iron levels affected mitochondrial manganese availability, MnSOD activity, and insulin secretion. We therefore sought to determine the metallation status of MnSOD in wild-type mice and whether altering that status affected β-cell function. 129/SvEVTac mice given supplemental manganese exhibited a 73% increase in hepatic MnSOD activity and increased metallation of MnSOD. To determine whether manganese supplementation offered glucose homeostasis under a situation of β-cell stress, we challenged C57BL/6J mice, which are more susceptible to diet-induced diabetes, with a high-fat diet for 12 weeks. Manganese was supplemented or not for the final 8 weeks on that diet, after which we examined glucose tolerance and the function of isolated islets. Liver mitochondria from manganese-injected C57BL/6J mice had similar increases in MnSOD activity (81%) and metallation as were seen in 129/SvEVTac mice. The manganese-treated group fed high fat had improved glucose tolerance (24% decrease in fasting glucose and 41% decrease in area under the glucose curve), comparable with mice on normal chow and increased serum insulin levels. Isolated islets from the manganese-treated group exhibited improved insulin secretion, decreased lipid peroxidation, and improved mitochondrial function. In conclusion, MnSOD metallation and activity can be augmented with manganese supplementation in normal mice on normal chow, and manganese treatment can increase insulin secretion to improve glucose tolerance under conditions of dietary stress.
Figures
Similar articles
-
Iron-mediated inhibition of mitochondrial manganese uptake mediates mitochondrial dysfunction in a mouse model of hemochromatosis.Mol Med. 2008 Mar-Apr;14(3-4):98-108. doi: 10.2119/2007-00114.Jouihan. Mol Med. 2008. PMID: 18317567 Free PMC article.
-
Metallothionein 1 negatively regulates glucose-stimulated insulin secretion and is differentially expressed in conditions of beta cell compensation and failure in mice and humans.Diabetologia. 2019 Dec;62(12):2273-2286. doi: 10.1007/s00125-019-05008-3. Epub 2019 Oct 17. Diabetologia. 2019. PMID: 31624901
-
Effects of glucokinase haploinsufficiency on the pancreatic β-cell mass and function of long-term high-fat, high-sucrose diet-fed mice.J Diabetes Investig. 2024 Dec;15(12):1732-1742. doi: 10.1111/jdi.14307. Epub 2024 Sep 21. J Diabetes Investig. 2024. PMID: 39305123 Free PMC article.
-
Prolonged ethanol administration depletes mitochondrial DNA in MnSOD-overexpressing transgenic mice, but not in their wild type littermates.Toxicol Appl Pharmacol. 2009 Feb 1;234(3):326-38. doi: 10.1016/j.taap.2008.11.004. Epub 2008 Nov 20. Toxicol Appl Pharmacol. 2009. PMID: 19063909
-
Zinc Supplementation Improves Glucose Homeostasis in High Fat-Fed Mice by Enhancing Pancreatic β-Cell Function.Nutrients. 2017 Oct 20;9(10):1150. doi: 10.3390/nu9101150. Nutrients. 2017. PMID: 29053582 Free PMC article.
Cited by
-
Oxidative Stress as the Main Target in Diabetic Retinopathy Pathophysiology.J Diabetes Res. 2019 Aug 14;2019:8562408. doi: 10.1155/2019/8562408. eCollection 2019. J Diabetes Res. 2019. PMID: 31511825 Free PMC article. Review.
-
Impact of in vitro heavy metal exposure on pancreatic β-cell function.Toxicol Lett. 2018 Dec 15;299:137-144. doi: 10.1016/j.toxlet.2018.09.015. Epub 2018 Oct 6. Toxicol Lett. 2018. PMID: 30300733 Free PMC article.
-
The Essential Element Manganese, Oxidative Stress, and Metabolic Diseases: Links and Interactions.Oxid Med Cell Longev. 2018 Apr 5;2018:7580707. doi: 10.1155/2018/7580707. eCollection 2018. Oxid Med Cell Longev. 2018. PMID: 29849912 Free PMC article. Review.
-
Association between Dietary Manganese Intake and Mortality from Cardiovascular Disease in Japanese Population: The Japan Collaborative Cohort Study.J Atheroscler Thromb. 2022 Oct 1;29(10):1432-1447. doi: 10.5551/jat.63195. Epub 2022 Jan 26. J Atheroscler Thromb. 2022. PMID: 35082202 Free PMC article.
-
Dietary Manganese Modulates PCB126 Toxicity, Metal Status, and MnSOD in the Rat.Toxicol Sci. 2016 Mar;150(1):15-26. doi: 10.1093/toxsci/kfv312. Epub 2015 Dec 10. Toxicol Sci. 2016. PMID: 26660635 Free PMC article.
References
-
- McClain DA, Abraham D, Rogers J, et al. High prevalence of abnormal glucose homeostasis secondary to decreased insulin secretion in individuals with hereditary haemochromatosis. Diabetologia. 2006;49(7):1661–1669 - PubMed
-
- Hatunic M, Finucane FM, Brennan AM, Norris S, Pacini G, Nolan JJ. Effect of iron overload on glucose metabolism in patients with hereditary hemochromatosis. Metabolism. 2010;59(3):380–384 - PubMed
-
- Facchini FS. Effect of phlebotomy on plasma glucose and insulin concentrations. Diabetes Care. 1998;21(12):2190. - PubMed
-
- Fernandez-Real JM, Penarroja G, Castro A, Garcia-Bragado F, Hernandez-Aguado I, Ricart W. Blood letting in high-ferritin type 2 diabetes: effects on insulin sensitivity and beta-cell function. Diabetes. 2002;51(4):1000–1004 - PubMed
-
- Cooksey RC, Jouihan HA, Ajioka RS, et al. Oxidative stress, β-cell apoptosis, and decreased insulin secretory capacity in mouse models of hemochromatosis. Endocrinology. 2004;145(11):5305–5312 - PubMed
Publication types
MeSH terms
Substances
Grants and funding
LinkOut - more resources
Full Text Sources
Other Literature Sources
Medical
