Effect of oral appliances on blood pressure in obstructive sleep apnea: a systematic review and meta-analysis
- PMID: 23372472
- PMCID: PMC3544387
- DOI: 10.5664/jcsm.2420
Effect of oral appliances on blood pressure in obstructive sleep apnea: a systematic review and meta-analysis
Abstract
Background: Obstructive sleep apnea (OSA) is an independent risk factor for the development of hypertension. However the effect of continuous positive airway pressure (CPAP) on lowering systemic blood pressure (BP) in OSA patients has been conflicting. Oral appliance (OA) therapy is an important alternative therapy to CPAP for patients with mild to moderate OSA.
Objective: To conduct a meta-analysis of studies which have evaluated the effect of OAs on BP in patients with OSA.
Data sources: Studies were retrieved by searching PubMed (all studies that were published until December 15, 2011)
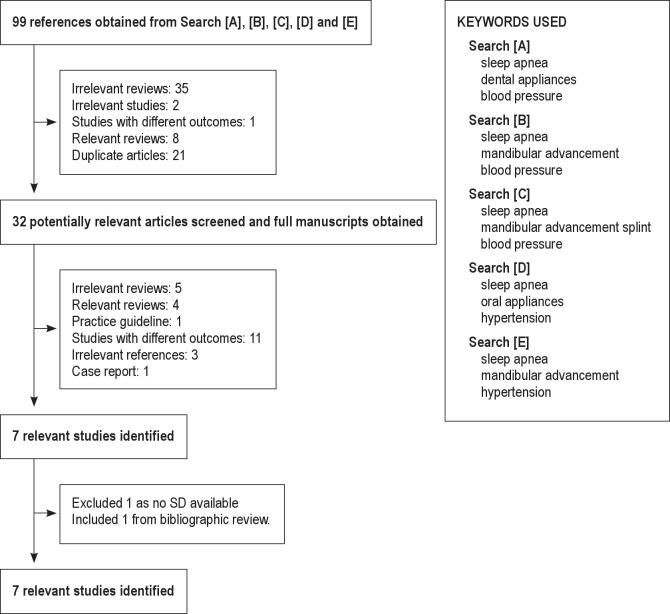
Study selection: Three independent reviewers screened citations to identify trials of the effect of OA on BP.
Data extraction: Data from observational and randomized controlled trial (RCT) studies was extracted for pre- and post-treatment systolic, diastolic, and mean arterial blood pressure (SBP, DBP, and MAP).
Data synthesis: A total of 7 studies that enrolled 399 participants met the inclusion criteria. The pooled estimate of mean changes and the corresponding 95% CIs for SBP, DBP, and MAP from each trial are -2.7 mm Hg (95% CI: -0.8 to -4.6), p-value 0.04; -2.7 mm Hg (95% CI: -0.9 to -4.6), p-value 0.004; and -2.40 mm Hg (95% CI: -4.01 to -0.80), p-value 0.003 (Figures 2-4). The pooled estimate of mean changes and the corresponding 95% CIs for nocturnal SBP, DBP, and MAP from each trial are -2.0 mm Hg (95% CI: 1.1 to -5.3), p-value 0.212; -1.7 mm Hg (95% CI: -0.1 to -3.2), p-value 0.03; and -1.9 mm Hg (95% CI: 1.3 to -5.1), p-value 0.255 (Figures 5-7) respectively.
Conclusions: The pooled estimate shows a favorable effect of OAs on SBP, MAP, and DBP. Most of the studies were observational. Therefore, more RCTs are warranted involving a larger number of patients and longer treatment periods to confirm the effects of OA on BP.
Figures


Similar articles
-
CPAP vs Mandibular Advancement Devices and Blood Pressure in Patients With Obstructive Sleep Apnea: A Systematic Review and Meta-analysis.JAMA. 2015 Dec 1;314(21):2280-93. doi: 10.1001/jama.2015.16303. JAMA. 2015. PMID: 26624827
-
Drug therapy for obstructive sleep apnoea in adults.Cochrane Database Syst Rev. 2006 Apr 19;(2):CD003002. doi: 10.1002/14651858.CD003002.pub2. Cochrane Database Syst Rev. 2006. Update in: Cochrane Database Syst Rev. 2013 May 31;(5):CD003002. doi: 10.1002/14651858.CD003002.pub3. PMID: 16625567 Updated.
-
Blood pressure lowering efficacy of renin inhibitors for primary hypertension.Cochrane Database Syst Rev. 2017 Apr 5;4(4):CD007066. doi: 10.1002/14651858.CD007066.pub3. Cochrane Database Syst Rev. 2017. PMID: 28379619 Free PMC article.
-
Effects of opioid, hypnotic and sedating medications on sleep-disordered breathing in adults with obstructive sleep apnoea.Cochrane Database Syst Rev. 2015 Jul 14;(7):CD011090. doi: 10.1002/14651858.CD011090.pub2. Cochrane Database Syst Rev. 2015. PMID: 26171909
-
The effect of continuous positive airway pressure treatment on blood pressure: a systematic review and meta-analysis of randomized controlled trials.J Clin Sleep Med. 2012 Oct 15;8(5):587-96. doi: 10.5664/jcsm.2170. J Clin Sleep Med. 2012. PMID: 23066375 Free PMC article.
Cited by
-
Consensus and evidence-based Indian initiative on obstructive sleep apnea guidelines 2014 (first edition).Lung India. 2015 Jul-Aug;32(4):422-34. doi: 10.4103/0970-2113.159677. Lung India. 2015. PMID: 26180408 Free PMC article.
-
Hypertension and obstructive sleep apnea.Hypertens Res. 2016 Jun;39(6):391-5. doi: 10.1038/hr.2016.11. Epub 2016 Feb 18. Hypertens Res. 2016. PMID: 26888120 Review.
-
Oral appliance treatment in moderate and severe obstructive sleep apnoea patients non-adherent to CPAP.J Oral Rehabil. 2016 Apr;43(4):249-58. doi: 10.1111/joor.12376. Epub 2015 Dec 27. J Oral Rehabil. 2016. PMID: 26707632 Free PMC article.
-
Obstructive Sleep Apnea and Hypertension: A Review of the Relationship and Pathogenic Association.Cureus. 2020 May 22;12(5):e8241. doi: 10.7759/cureus.8241. Cureus. 2020. PMID: 32582500 Free PMC article. Review.
-
Update on oral appliance therapy.Eur Respir Rev. 2019 Sep 25;28(153):190083. doi: 10.1183/16000617.0083-2019. Print 2019 Sep 30. Eur Respir Rev. 2019. PMID: 31554705 Free PMC article. Review.
References
-
- Young T, Peppard PE, Gottlieb DJ. Epidemiology of obstructive sleep apnea: a population health perspective. Am J Respir Crit Care Med. 2002;165:1217–39. - PubMed
-
- Young T, Palta M, Dempsey J, Skatrud J, Weber S, Badr S. The occurrence of sleep-disordered breathing among middle-aged adults. N Engl J Med. 1993;328:1230–5. - PubMed
-
- Peppard PE, Young T, Palta M, Skatrud J. Prospective study of the association between sleep-disordered breathing and hypertension. N Engl J Med. 2000;342:1378–84. - PubMed
-
- Nieto FJ, Young TB, Lind BK, et al. Association of sleep-disordered breathing, sleep apnea, and hypertension in a large community-based study. Sleep Heart Health Study. JAMA. 2000;283:1829–36. - PubMed
-
- Peppard PE, Young T, Palta M, Dempsey J, Skatrud J. Longitudinal study of moderate weight change and sleep-disordered breathing. JAMA. 2000;284:3015–21. - PubMed
Publication types
MeSH terms
Grants and funding
LinkOut - more resources
Full Text Sources
Other Literature Sources
Medical
Miscellaneous