

Optical imaging of plastic changes induced by fear conditioning in the auditory cortex
- PMID: 23372615
- PMCID: PMC3253167
- DOI: 10.1007/s11571-011-9173-x
Optical imaging of plastic changes induced by fear conditioning in the auditory cortex
Abstract
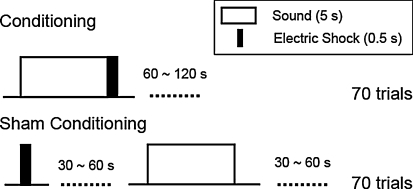
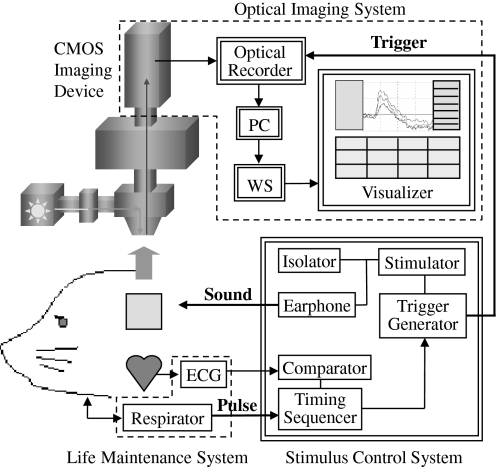
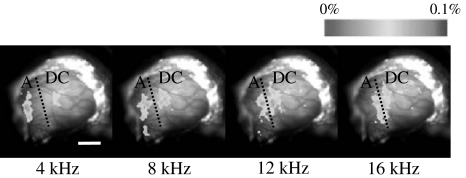
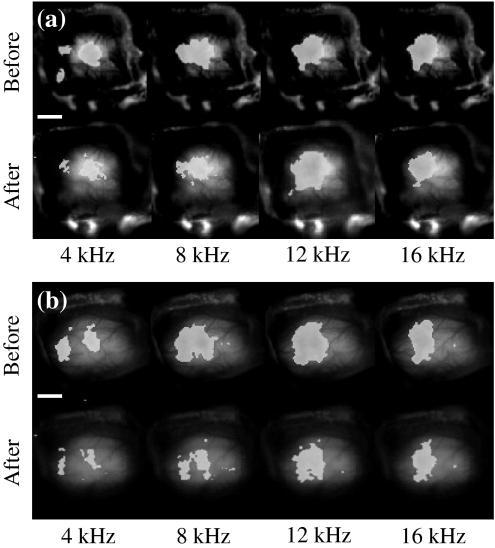
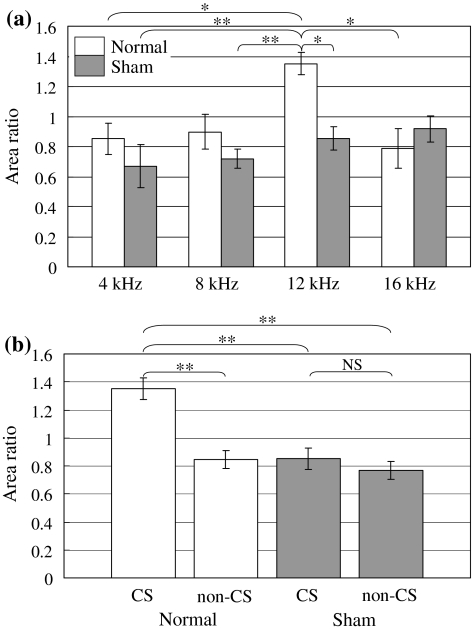
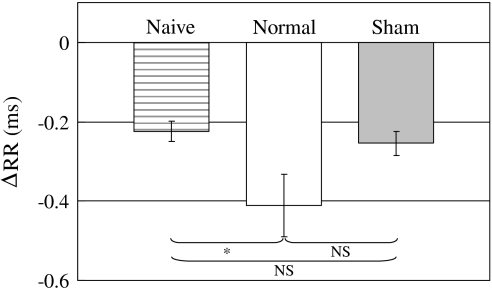
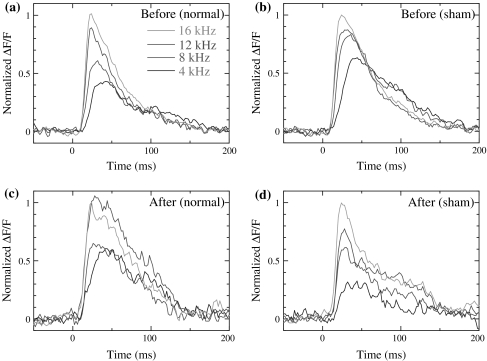
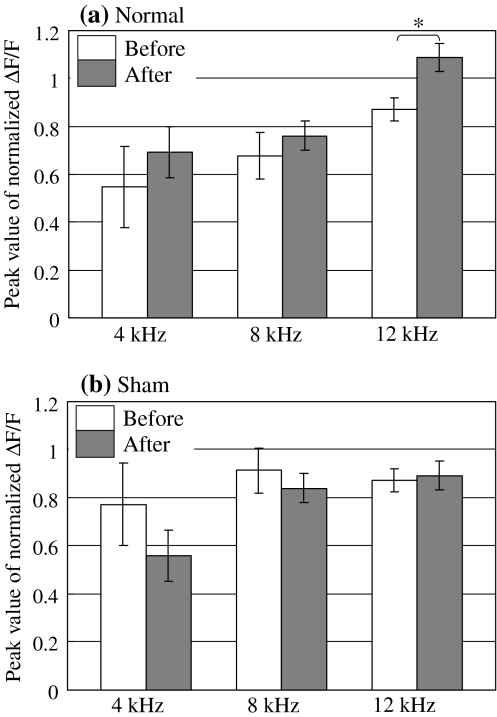
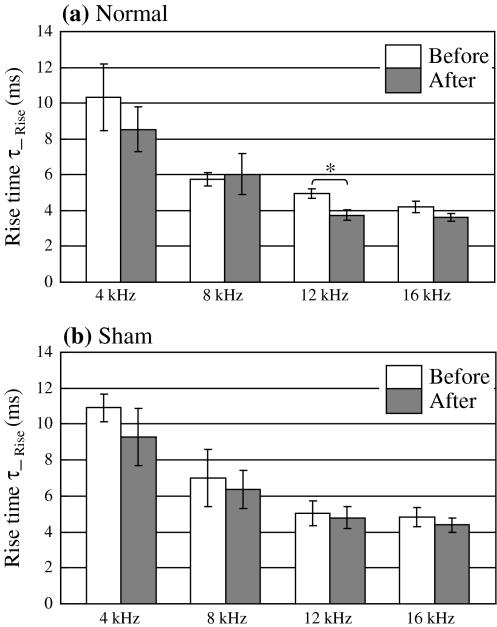
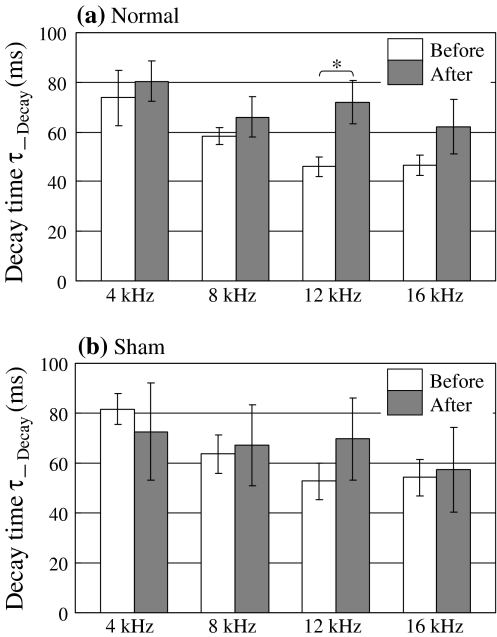
The plastic changes in the auditory cortex induced by a fear conditioning, through pairing a sound (CS) with an electric foot-shock (US), were investigated using an optical recording method with voltage sensitive dye, RH795. In order to investigate the effects of association learning, optical signals in the auditory cortex in response to CS (12 kHz pure tone) and non-CS (4, 8, 16 kHz pure tone) were recorded before and after normal and sham conditioning. As a result, the response area to CS enlarged only in the conditioning group after the conditioning. Additionally, the rise time constant of the auditory response to CS significantly decreased and the relative peak value and the decay time constant of the auditory response to CS significantly increased after the conditioning. This study introduces an optical approach to the investigation of fear conditioning, representational plasticity, and the cholinergic system. The findings are synthesized in a model of the synaptic mechanisms that underlie cortical plasticity.
Keywords: Auditory cortex; Fear conditioning; Optical imaging; Plastic change; Voltage sensitive dye.
Figures
Similar articles
-
Fear conditioning induces guinea pig auditory cortex activation by foot shock alone.Cogn Neurodyn. 2013 Feb;7(1):67-77. doi: 10.1007/s11571-012-9224-y. Epub 2012 Oct 2. Cogn Neurodyn. 2013. PMID: 24427192 Free PMC article.
-
Tone-specific and nonspecific plasticity of the auditory cortex elicited by pseudoconditioning: role of acetylcholine receptors and the somatosensory cortex.J Neurophysiol. 2008 Sep;100(3):1384-96. doi: 10.1152/jn.90340.2008. Epub 2008 Jul 2. J Neurophysiol. 2008. PMID: 18596186 Free PMC article.
-
Tone-specific and nonspecific plasticity of inferior colliculus elicited by pseudo-conditioning: role of acetylcholine and auditory and somatosensory cortices.J Neurophysiol. 2009 Aug;102(2):941-52. doi: 10.1152/jn.00222.2009. Epub 2009 May 27. J Neurophysiol. 2009. PMID: 19474174 Free PMC article.
-
Learning-induced physiological memory in adult primary auditory cortex: receptive fields plasticity, model, and mechanisms.Audiol Neurootol. 1998 Mar-Jun;3(2-3):145-67. doi: 10.1159/000013787. Audiol Neurootol. 1998. PMID: 9575382 Review.
-
Behavioral verification of associative learning in whiskers-related fear conditioning in mice.Acta Neurobiol Exp (Wars). 2016;76(2):87-97. doi: 10.21307/ane-2017-008. Acta Neurobiol Exp (Wars). 2016. PMID: 27373946 Review.
Cited by
-
Fear conditioning induces guinea pig auditory cortex activation by foot shock alone.Cogn Neurodyn. 2013 Feb;7(1):67-77. doi: 10.1007/s11571-012-9224-y. Epub 2012 Oct 2. Cogn Neurodyn. 2013. PMID: 24427192 Free PMC article.
-
Multimodal cortico-cortical associations induced by fear and sensory conditioning in the guinea pig.Cogn Neurodyn. 2022 Apr;16(2):283-296. doi: 10.1007/s11571-021-09708-8. Epub 2021 Sep 8. Cogn Neurodyn. 2022. PMID: 35401874 Free PMC article.
-
Vagus nerve stimulation modulates information representation of sustained activity in layer specific manner in the rat auditory cortex.Front Neural Circuits. 2025 Jul 23;19:1569158. doi: 10.3389/fncir.2025.1569158. eCollection 2025. Front Neural Circuits. 2025. PMID: 40771876 Free PMC article.
References
LinkOut - more resources
Full Text Sources
Research Materials
