. 2013;8(1):e50128.
doi: 10.1371/journal.pone.0050128. Epub 2013 Jan 23.

PPAR-γ activation increases insulin secretion through the up-regulation of the free fatty acid receptor GPR40 in pancreatic β-cells

Affiliations

PPAR-γ activation increases insulin secretion through the up-regulation of the free fatty acid receptor GPR40 in pancreatic β-cells

Hyo-Sup Kim et al. PLoS One. 2013.

Abstract

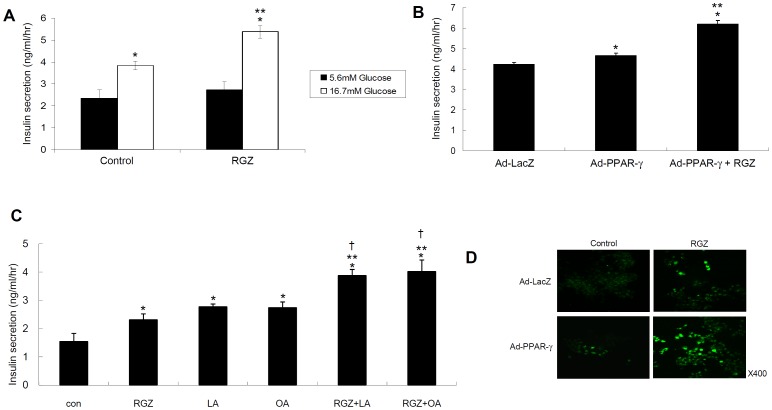
Background: It has been reported that peroxisome proliferator-activated receptor (PPAR)-γ and their synthetic ligands have direct effects on pancreatic β-cells. We investigated whether PPAR-γ activation stimulates insulin secretion through the up-regulation of GPR40 in pancreatic β-cells.

Methods: Rat insulinoma INS-1 cells and primary rat islets were treated with rosiglitazone (RGZ) and/or adenoviral PPAR-γ overexpression. OLETF rats were treated with RGZ.

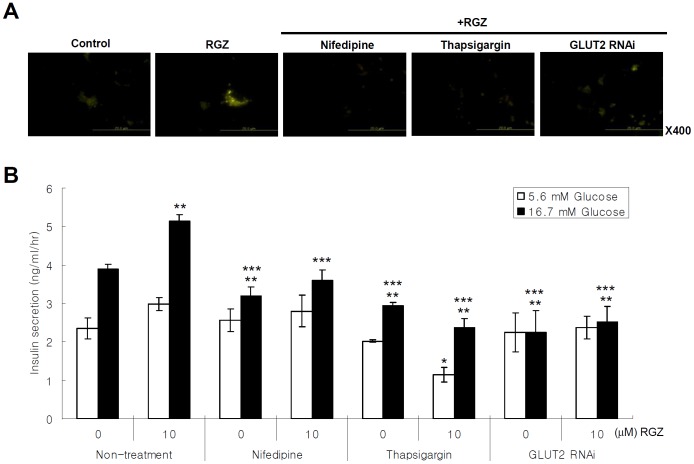
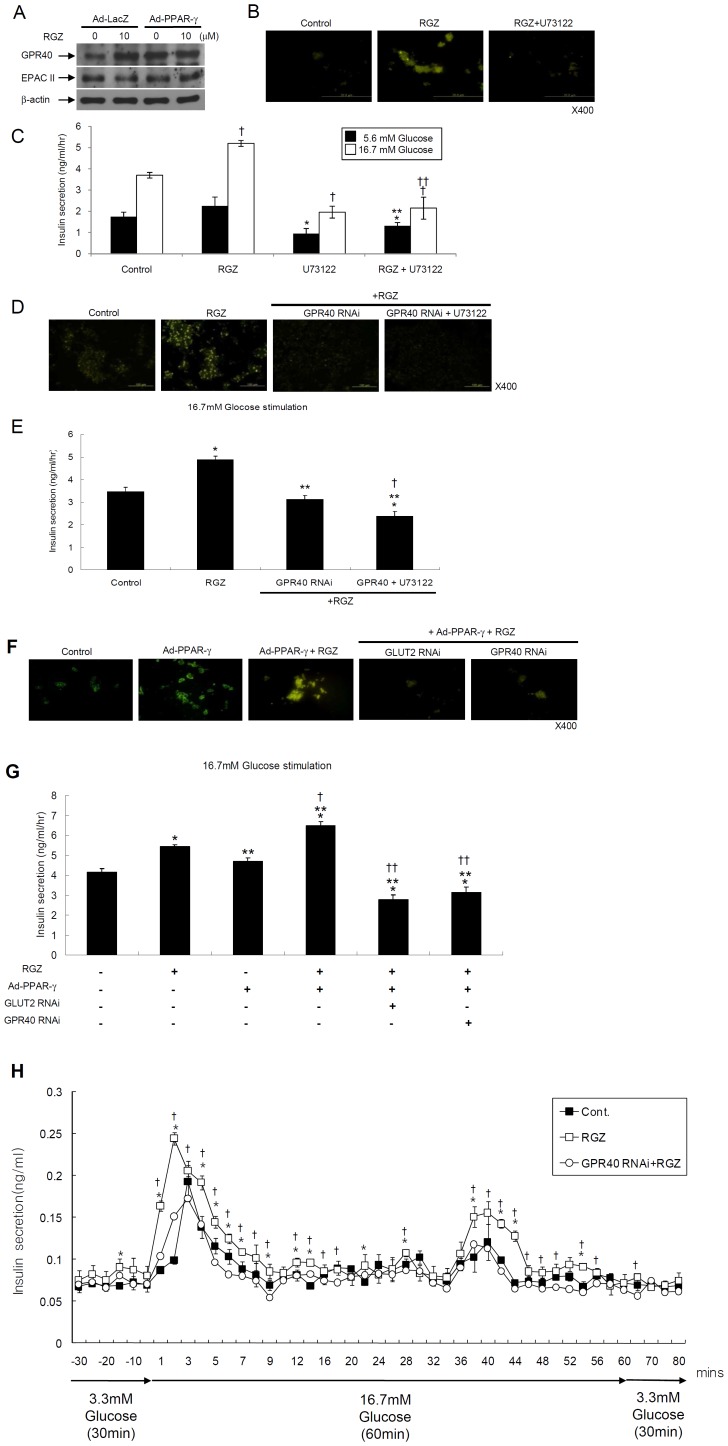
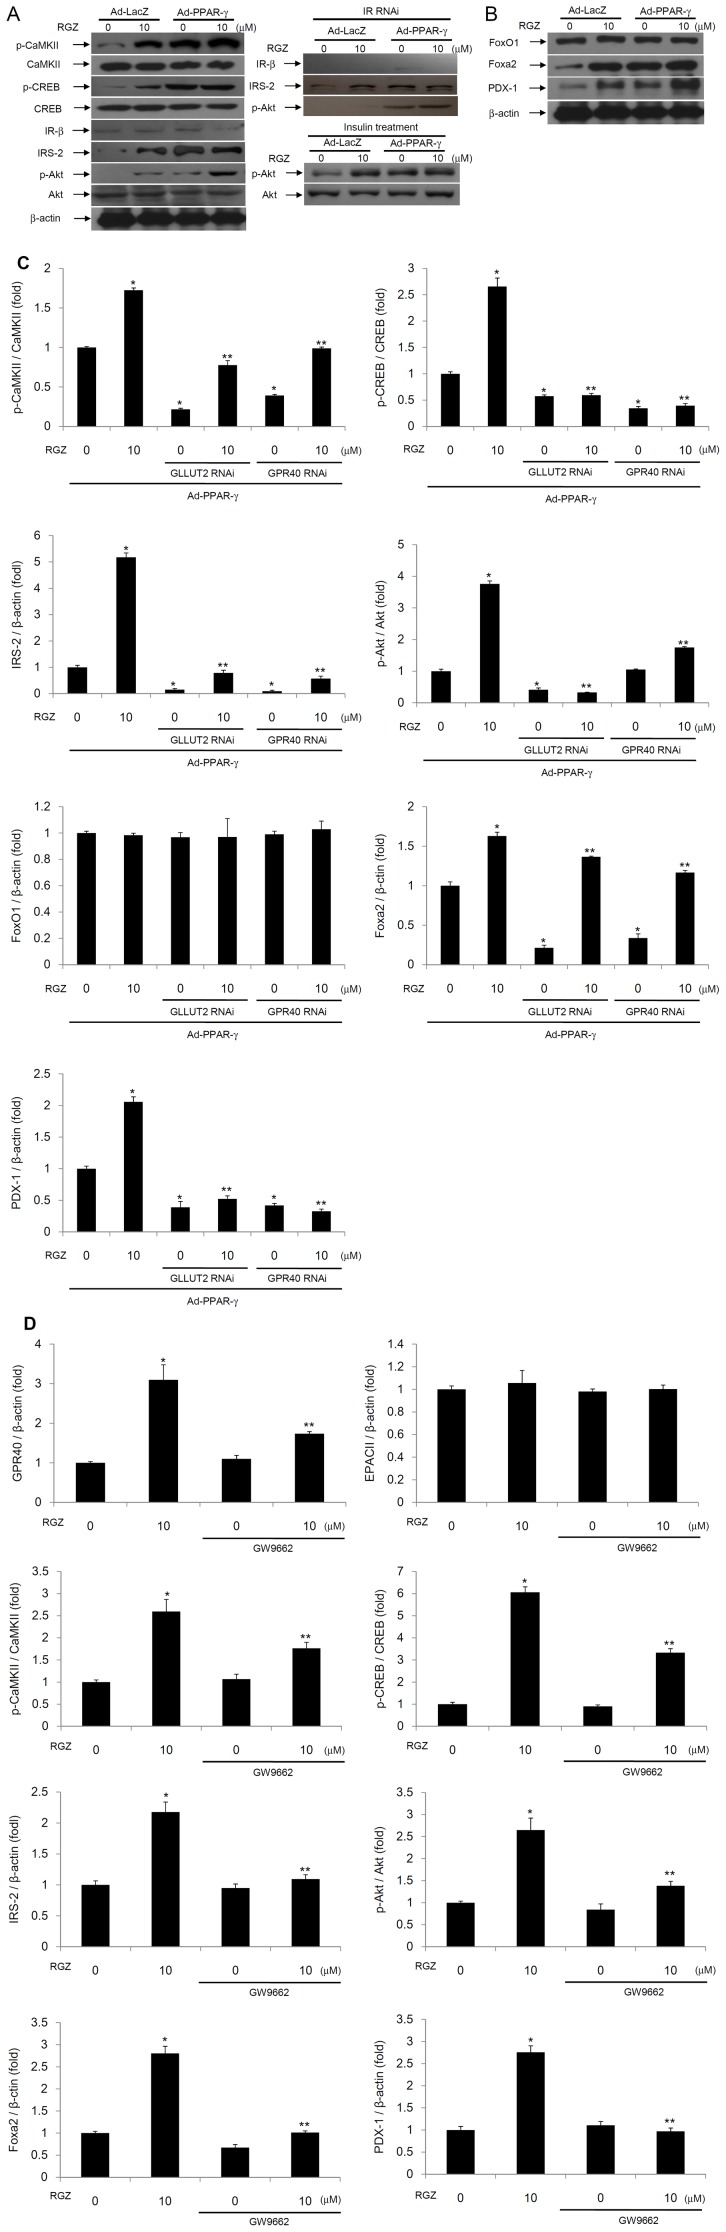
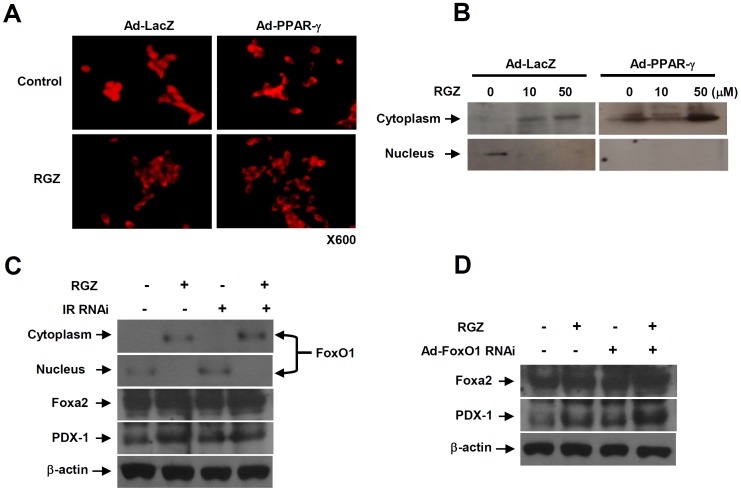
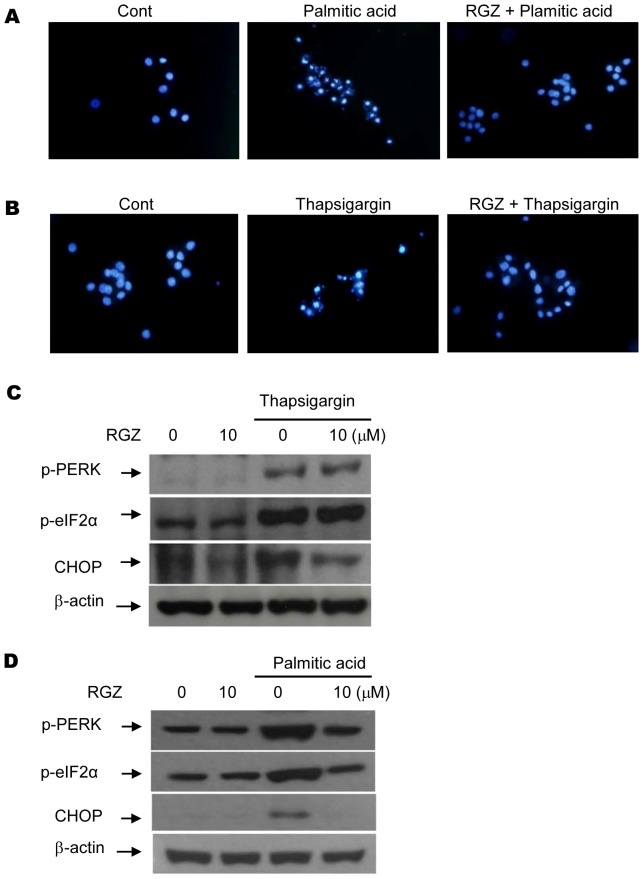
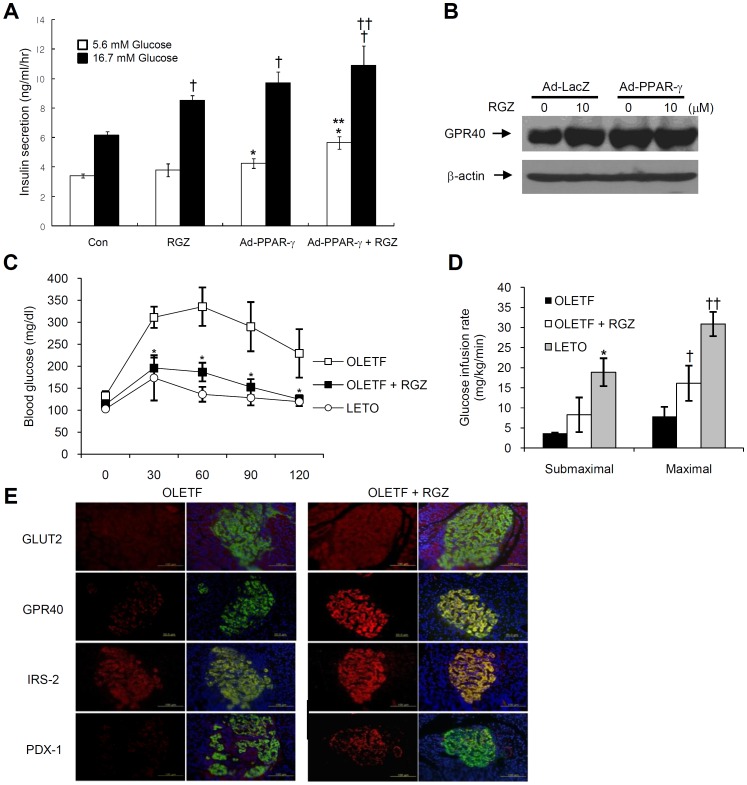
Results: PPAR-γ activation with RGZ and/or adenoviral PPAR-γ overexpression increased free fatty acid (FFA) receptor GPR40 expression, and increased insulin secretion and intracellular calcium mobilization, and was blocked by the PLC inhibitors, GPR40 RNA interference, and GLUT2 RNA interference. As a downstream signaling pathway of intracellular calcium mobilization, the phosphorylated levels of CaMKII and CREB, and the downstream IRS-2 and phospho-Akt were significantly increased. Despite of insulin receptor RNA interference, the levels of IRS-2 and phospho-Akt was still maintained with PPAR-γ activation. In addition, the β-cell specific gene expression, including Pdx-1 and FoxA2, increased in a GPR40- and GLUT2-dependent manner. The levels of GPR40, phosphorylated CaMKII and CREB, and β-cell specific genes induced by RGZ were blocked by GW9662, a PPAR-γ antagonist. Finally, PPAR-γ activation up-regulated β-cell gene expressions through FoxO1 nuclear exclusion, independent of the insulin signaling pathway. Based on immunohistochemical staining, the GLUT2, IRS-2, Pdx-1, and GPR40 were more strongly expressed in islets from RGZ-treated OLETF rats compared to control islets.

Conclusion: These observations suggest that PPAR-γ activation with RGZ and/or adenoviral overexpression increased intracellular calcium mobilization, insulin secretion, and β-cell gene expression through GPR40 and GLUT2 gene up-regulation.


Conflict of interest statement

Competing Interests: The authors have declared that no competing interests exist.

Figures

Figure 1
Figure 1. Effects of PPAR-γ activation on insulin secretion and intracellular calcium mobilization.
(A) INS-1 cells were treated with 10 µM RGZ for 24 h, and incubated for an additional 1 h in 5.6 or 16.7 mM of glucose conditions. Insulin was determined using a rat insulin ELISA kit (n = 4, * P<0.01 vs. 5.6 mM glucose; ** P<0.01 vs. control with 16.7 mM glucose). (B) INS-1 cells were infected with adenovirus containing human PPARγ1 complementary DNA or control virus. Insulin secretion was determined in 16.7 mM of glucose condition (n = 4, * P<0.05 vs. control virus treated cells; ** P<0.01 vs. adenoviral PPAR-γ overexpression). (C) INS-1 cells were treated with 10 µM RGZ for 24 h, and then 10 µM linoleic acid (LA) or oleic acid (OA) were added for 30 minutes (n = 4, * P<0.01 vs. control; ** P<0.01 vs. RGZ treatment; and P<0.01 vs. LA or OA treatment). (D) After treatment with RGZ and/or adenoviral PPARγ overexpression for 24 h, cells were stimulated with 16.7 mM glucose for 1 h, and then treated with 2 µM Fluo-4 for 30 min in the incubator with light protection.
Figure 2
Figure 2. RGZ induces intracellular calcium mobilization from extra- and intra-cellular sources.
(A) Effects of nifedipine (10 mM), thapsigargin (0.1 µM), and GLUT2 sequence-specific silencing with RNAi on 10 µM RGZ-induced intracellular calcium mobilization and (B) insulin secretion (ANOVA within same glucose conditions: n = 4, * P<0.01 vs. RGZ treatment with 5.6 mM glucose; ** P<0.05 vs. non-treatment with 16.7 mM glucose; and *** P<0.01 vs. RGZ treatment with 16.7 mM glucose) (C) Immunoblot for GLUT2 expression with 10 µM RGZ treatment and/or adenoviral PPAR-γ overexpression.
Figure 3
Figure 3. PPAR-γ activation increases intracellular calcium concentration and insulin secretion through GPR40 gene up-regulation.
(A) Immunoblot for GPR40 and EPAC II expression with 10 µM RGZ treatment and/or adenoviral PPAR-γ overexpression. (B) Effects of PLC inhibitor, U-73122 (20 µM), on RGZ-induced intracellular calcium mobilization and (C) insulin secretion (ANOVA within same glucose conditions: n = 4, * P<0.01 vs. control RGZ treatment with 5.6 mM glucose; ** P<0.01 vs. RGZ or U-73122 treatment with 5.6 mM glucose; P<0.01 vs. control with 16.7 mM glucose; and †† P<0.01 vs. RGZ or U-73122 treatment with 16.7 mM glucose). (D) Effects of GPR40 sequence-specific silencing with RNAi and/or U-73122 (20 µM), on RGZ-induced intracellular calcium mobilization and (E) insulin secretion (n = 4, * P<0.01 vs. control; ** P<0.01 vs. RGZ treatment; and P<0.01 vs. RGZ and GPR40 RNAi treatment). (F) Effects of GPR40 or GLUT2 RNAi on PPARγ-induced intracellular calcium mobilization and (G) insulin secretion (n = 4, * P<0.01 vs. control; ** P<0.01 vs. RGZ treatment; P<0.01 vs. adenoviral PPAR-γ overexpression; and †† P<0.01 vs. RGZ treatment+adenoviral PPAR-γ overexpression). (H) 1×10⁵ INS-1 cells were perifused in 3.3 mM glucose for 30 mins at flow rate of 1 ml/min, and then glucose concentrations were modified at 16.7 mM concentration. Fractions were collected at 1 min intervals during 1st peak insulin secretion and then collected at 2 min intervals (n = 4, * P<0.05 vs. control; P<0.01 vs. 10 µM RGZ and GPR40 RNAi treatment).
Figure 4
Figure 4. PPAR-γ activation induces the CaMKII and CREB signaling pathways through GPR40 and GLUT2 gene up-regulation.
(A, B) Immunoblot for genes involved in CREB signaling pathways and β-cell specific genes with RGZ and/or PPAR-γ overexpression. Immunoblot for IRS-2 and phospho-Akt with insulin receptor-specific RNAi. (C) Effects of GPR40 or GLUT2 RNAi on gene expressions involved in CREB signaling pathways and β-cell function (n = 4, * P<0.01 vs. adenoviral PPAR-γ overexpression; ** P<0.01 vs. RGZ treatment+adenoviral PPAR-γ overexpression). (D) Effect of co-treatment of 50 µM GW9662, a PPAR-γ antagonist, together with RGZ on the expression levels of GPR40, phospho-CaMKII, phospho-CREB, IRS-2, phospho-Akt, Pdx-1, and FoxA2 (n = 4, * P<0.01 vs. control; ** P<0.01 vs. RGZ treatment).
Figure 5
Figure 5. PPAR-γ activation up-regulates β-cell gene expression through FoxO1 nuclear exclusion.
(A, B) Immunostaining (A) and immunoblot (B) of nuclear-cytoplasm shuttling for FoxO1 with RGZ treatment and/or PPAR-γ overexpression. (C) Immunoblot for β-cell specific gene expressions and FoxO1 shuttling with insulin receptor RNAi. (D) Immunoblot for β-cell specific gene expressions after treatment with adenovirus containing rat FoxO1 shRNA.
Figure 6
Figure 6. RGZ treatment prevents lipotoxic and ER stress-induced β-cell apoptosis.
(A, B) INS-1 cells were pretreated with or without RGZ (10 µM) and challenged with palmitate (1.0 mM) or thapsigargin (50 µM) for 24 h. Cell apoptosis was examined by Hoechst staining. (C) Effect of RGZ treatment on CHOP expression induced by thapsigargin (50 µM). (D) Effect of RGZ treatment on CHOP expression induced by palmitate (1.0 mM).
Figure 7
Figure 7. PPAR-γ activation increases GPR40 expression in primary rat islets and OLETF rats.
(A) Primary rat islets were treated with 10 µM RGZ for 24 h, and incubated for an additional 1 h in 5.6 or 16.7 mM of glucose. Insulin was determined using a rat insulin ELISA kit (ANOVA within same glucose conditions: n = 4, * P<0.05 vs. control with 5.6 mM glucose; ** P<0.01 vs. RGZ or adenoviral PPAR-γ overexpression with 5.6 mM glucose; P<0.01 vs. control with 16.7 mM glucose; and †† P<0.01 vs. RGZ with 16.7 mM glucose). (B) Immunoblot for GPR40 expression with 10 µM RGZ treatment and/or adenoviral PPAR-γ overexpression. (C) At 10 weeks of age, OLETF rats were randomly assigned to the RGZ treatment or control group, and 3 mg/kg of RGZ was given by mouth through gavage. After 14 weeks of RGZ treatment (24 weeks of age), oral glucose tolerance test was performed (n = 4, * P<0.05 vs. OLETF rats). (D) At 24 weeks of age, hyperinsulinemic euglycemic clamping was performed and glucose infusion rate was measured. (ANOVA within same groups: n = 4, * P<0.05 vs. OLETF rats or OLETF rats+RGZ; ** P<0.05 vs. OLETF rats). (E) Immunohistochemical staining of GLUT2, IRS-2, Pdx-1, and GPR40.

Similar articles

Cited by

References

    1. Ferre P (2004) The biology of peroxisome proliferator-activated receptors: relationship with lipid metabolism and insulin sensitivity. Diabetes 53 Suppl 1: S43–S50. - PubMed
    1. Semple RK, Chatterjee VK, O'Rahilly S (2006) PPAR gamma and human metabolic disease. J Clin Invest 116: 581–589. - PMC - PubMed
    1. Santini E, Fallahi P, Ferrari SM, Masoni A, Antonelli A, et al. (2004) Effect of PPAR-gamma activation and inhibition on glucose-stimulated insulin release in INS-1e cells. Diabetes 53 Suppl 3: S79–S83. - PubMed
    1. Gupta D, Jetton TL, Mortensen RM, Duan SZ, Peshavaria M, et al. (2008) In vivo and in vitro studies of a functional peroxisome proliferator-activated receptor gamma response element in the mouse pdx-1 promoter. J Biol Chem 283: 32462–32470. - PMC - PubMed
    1. Kim HI, Cha JY, Kim SY, Kim JW, Roh KJ, et al. (2002) Peroxisomal proliferator-activated receptor-gamma upregulates glucokinase gene expression in beta-cells. Diabetes 51: 676–685. - PubMed

Publication types

MeSH terms