. 2013;8(1):e51951.
doi: 10.1371/journal.pone.0051951. Epub 2013 Jan 23.

Discriminating survival outcomes in patients with glioblastoma using a simulation-based, patient-specific response metric

Affiliations

Discriminating survival outcomes in patients with glioblastoma using a simulation-based, patient-specific response metric

Maxwell Lewis Neal et al. PLoS One. 2013.

Abstract

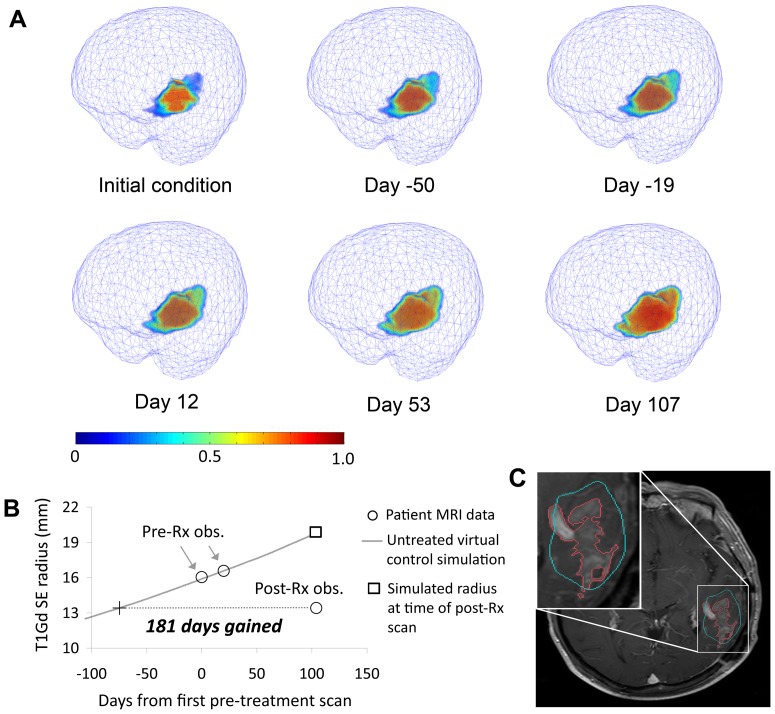
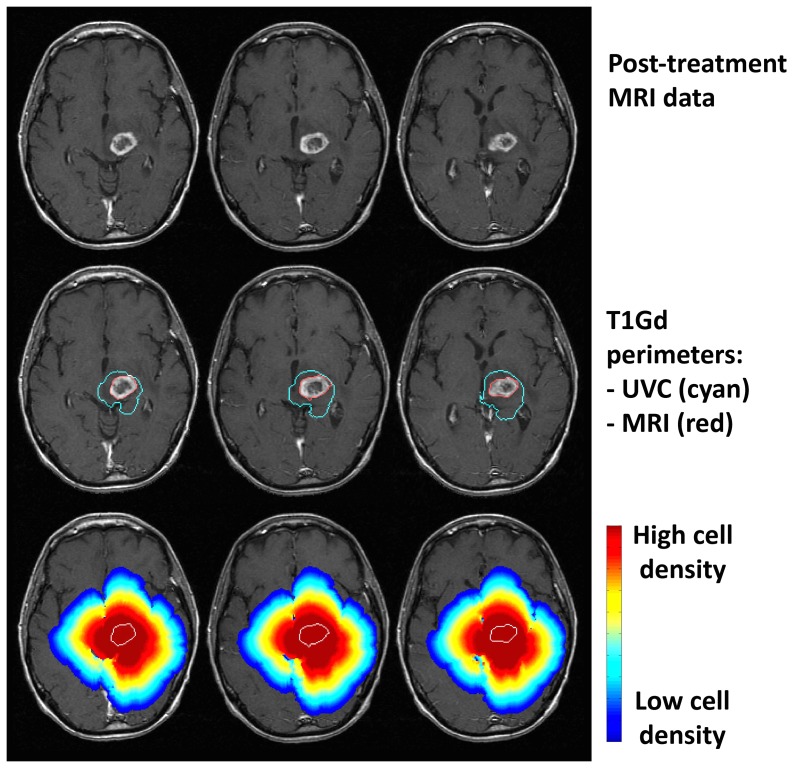
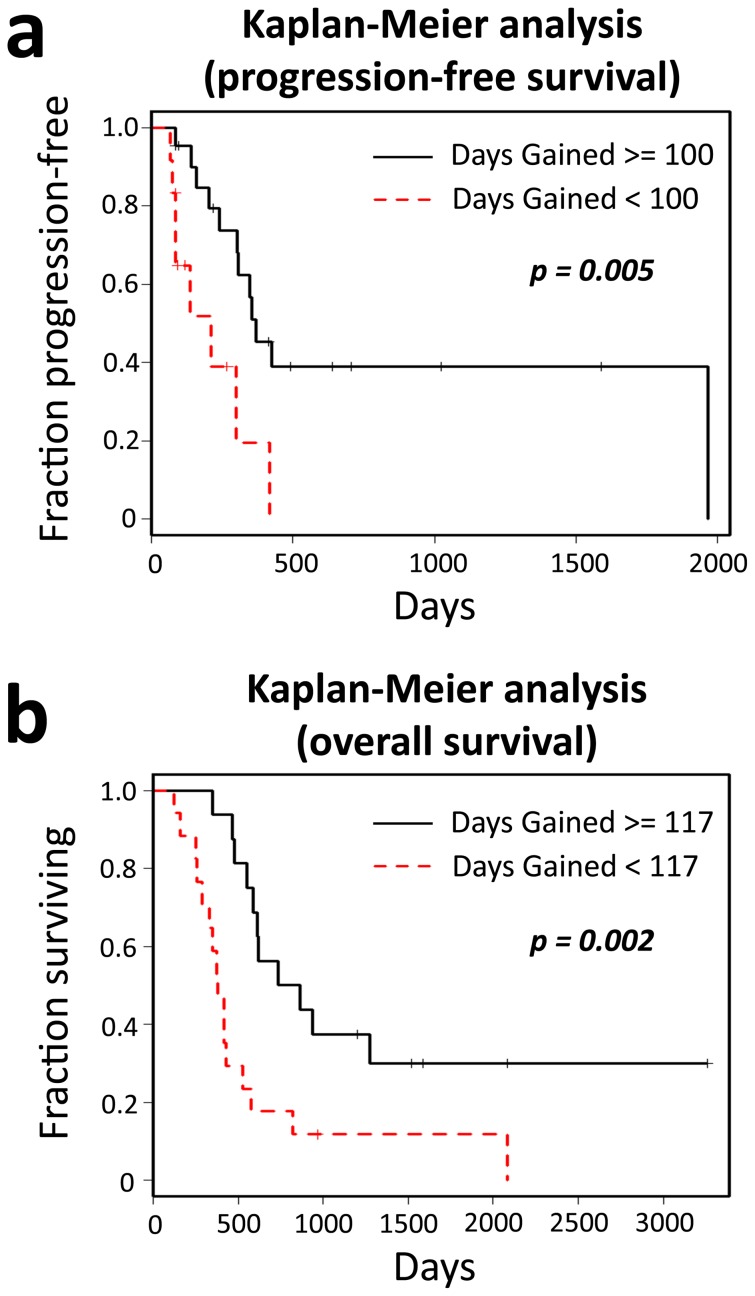
Accurate clinical assessment of a patient's response to treatment for glioblastoma multiforme (GBM), the most malignant type of primary brain tumor, is undermined by the wide patient-to-patient variability in GBM dynamics and responsiveness to therapy. Using computational models that account for the unique geometry and kinetics of individual patients' tumors, we developed a method for assessing treatment response that discriminates progression-free and overall survival following therapy for GBM. Applying these models as untreated virtual controls, we generate a patient-specific "Days Gained" response metric that estimates the number of days a therapy delayed imageable tumor progression. We assessed treatment response in terms of Days Gained scores for 33 patients at the time of their first MRI scan following first-line radiation therapy. Based on Kaplan-Meier analyses, patients with Days Gained scores of 100 or more had improved progression-free survival, and patients with scores of 117 or more had improved overall survival. Our results demonstrate that the Days Gained response metric calculated at the routinely acquired first post-radiation treatment time point provides prognostic information regarding progression and survival outcomes. Applied prospectively, our model-based approach has the potential to improve GBM treatment by accounting for patient-to-patient heterogeneity in GBM dynamics and responses to therapy.


Conflict of interest statement

Competing Interests: The authors have declared that no competing interests exist.

Figures

Figure 1
Figure 1. Growth of an untreated virtual control (UVC) tumor for a 57 year-old patient with a left fronto-parietal lobe glioblastoma.
a: Volumetric images of the untreated virtual control at six time points where Day 0 is the time of the patient's first pre-treatment MRI scan. Pseudocoloring indicates the tumor cell density, normalized to the maximum cell density of the tissue. b: T1Gd spherically-equivalent radius time curve from same simulation showing how the Days Gained score is computed. c: Post-treatment T1Gd MRI slice showing actual tumor (red outline) and perimeter of the simulated tumor's T1Gd-enhancing region at the same time point (cyan outline). Image oriented according to radiological convention: patient left is on the right.
Figure 2
Figure 2. Comparisons between T1Gd MRI data and untreated virtual control (UVC) prediction at post-treatment time point.
Patient was 58 years old and underwent biopsy followed by conformal radiation therapy with concurrent temozolomide chemotherapy. Top row: MRI data. Middle row: Actual tumor perimeter (red) with superimposed UVC-predicted tumor perimeter (cyan). Bottom row: full distribution of UVC cell densities showing invasion peripheral to abnormality. Outermost blue cell density profile represents a very low, but non-zero, threshold. Perimeter of actual tumor outlined in white.
Figure 3
Figure 3. Spatial comparisons between baseline pre-treatment MRI (red outline) and simulation results (cyan outline) seeded with our initial condition. a: large tumor on T1Gd MRI.
b: smaller tumor on FLAIR MRI. c: Highly anisotropic tumor growth on T2-weighted MRI. Our simulations produce tight spatial matches to a range of tumors (a and b), but decrease in accuracy for tumors with high anisotropy (c).
Figure 4
Figure 4. Kaplan-Meier analyses on progression-free and overall survival.
a: Analysis on progression-free survival data revealed a significant difference between the patients with Days Gained scores greater than or equal to 100 and those with lower scores. b: Overall survival analysis also revealed a significant difference between the patients with Days Gained scores greater than or equal to 117 and those with lower scores.

References

    1. Alvord EC Jr (1995) Patterns of growth of gliomas. American Journal of Neuroradiology 16: 1013. - PMC - PubMed
    1. Alvord Jr EC, Shaw CM (1991) Neoplasms affecting the nervous system of the elderly. In: Duckett S, editor. The Pathology of the Aging Human Nervous System. Philadelphia: Lea and Fabiger. pp. 210–286.
    1. Harpold HL, Alvord EC Jr, Swanson KR (2007) The evolution of mathematical modeling of glioma proliferation and invasion. Journal of Neuropathology & Experimental Neurology 66: 1–9. - PubMed
    1. Wang CH, Rockhill JK, Mrugala M, Peacock DL, Lai A, et al. (2009) Prognostic significance of growth kinetics in newly diagnosed glioblastomas revealed by combining serial imaging with a novel biomathematical model. Cancer Research 69: 9133–9140. - PMC - PubMed
    1. Macdonald DR, Cascino TL, Schold SC, Cairncross JG (1990) Response criteria for phase II studies of supratentorial malignant glioma. Journal of Clinical Oncology 8: 1277. - PubMed

Publication types

MeSH terms