

Global spatio-temporal patterns in human migration: a complex network perspective
- PMID: 23372664
- PMCID: PMC3553122
- DOI: 10.1371/journal.pone.0053723
Global spatio-temporal patterns in human migration: a complex network perspective
Abstract
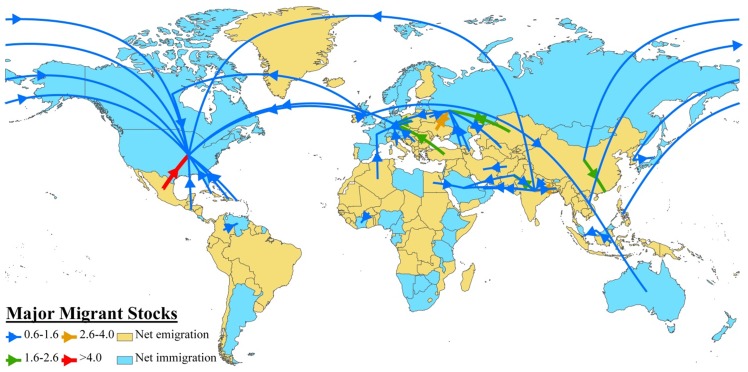
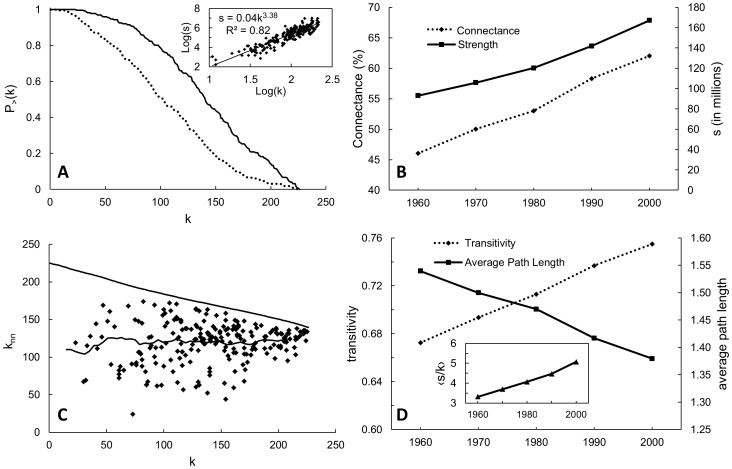
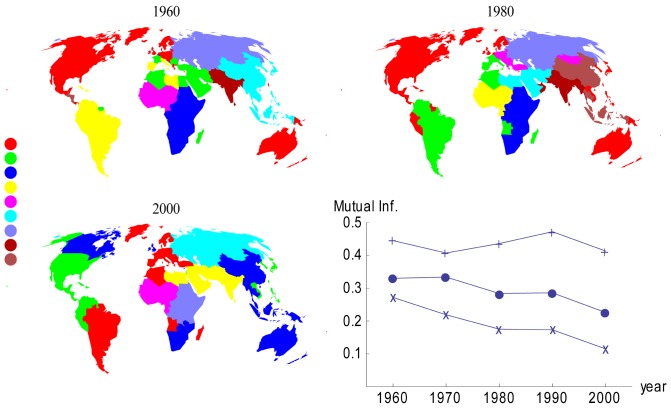
Migration is a powerful adaptive strategy for humans to navigate hardship and pursue a better quality of life. As a universal vehicle facilitating exchanges of ideas, culture, money and goods, international migration is a major contributor to globalization. Consisting of countries linked by multiple connections of human movements, global migration constitutes a network. Despite the important role of human migration in connecting various communities in different parts of the world, the topology and behavior of the international migration network and its changes through time remain poorly understood. Here we show that the global human migration network became more interconnected during the latter half of the twentieth century and that migrant destination choice partly reflects colonial and postcolonial histories, language, religion, and distances. From 1960 to 2000 we found a steady increase in network transitivity (i.e. connectivity between nodes connected to the same node), a decrease in average path length and an upward shift in degree distribution, all of which strengthened the 'small-world' behavior of the migration network. Furthermore, we found that distinct groups of countries preferentially interact to form migration communities based largely on historical, cultural and economic factors.
Conflict of interest statement
Figures
References
-
- Taylor JE (1999) The new economics of labour migration and the role of remittances in the migration process. Int Migr 37: 63–86. - PubMed
-
- Adams RH, Page J (2005) Do international migration and remittances reduce poverty in developing countries?. World Devel 33: 1645–1669 (DOI 10.1016/j.worlddev.2005.05.004.).
-
- Väyrynen R (2003) Illegal immigration, human trafficking, and organized crime (WIDER Discussion Paper 2003/72). Helsinki: UNU-WIDER.
-
- Laczko F, Aghazarm C, editors (2009) Migration, Environment and Climate Change: Assessing the Evidence, Geneva: International Organization for Migration. 441 p.
-
- Koser K, Laczko F, editors (2010) World Migration Report 2010 – The Future of Migration: Building Capacities for Change, Geneva: International Organization for Migration. 272 p.
Publication types
MeSH terms
LinkOut - more resources
Full Text Sources
Other Literature Sources
