

MicroRNA-221 induces cell survival and cisplatin resistance through PI3K/Akt pathway in human osteosarcoma
- PMID: 23372675
- PMCID: PMC3553141
- DOI: 10.1371/journal.pone.0053906
MicroRNA-221 induces cell survival and cisplatin resistance through PI3K/Akt pathway in human osteosarcoma
Erratum in
- PLoS One. 2013;8(5). doi:10.1371/annotation/f47e2af6-da90-40ee-871c-f9ed6f58a48c
Abstract
Background: MicroRNAs are short regulatory RNAs that negatively modulate protein expression at a post-transcriptional and/or translational level and are deeply involved in the pathogenesis of several types of cancers. Specifically, microRNA-221 (miR-221) is overexpressed in many human cancers, wherein accumulating evidence indicates that it functions as an oncogene. However, the function of miR-221 in human osteosarcoma has not been totally elucidated. In the present study, the effects of miR-221 on osteosarcoma and the possible mechanism by which miR-221 affected the survival, apoptosis, and cisplatin resistance of osteosarcoma were investigated.
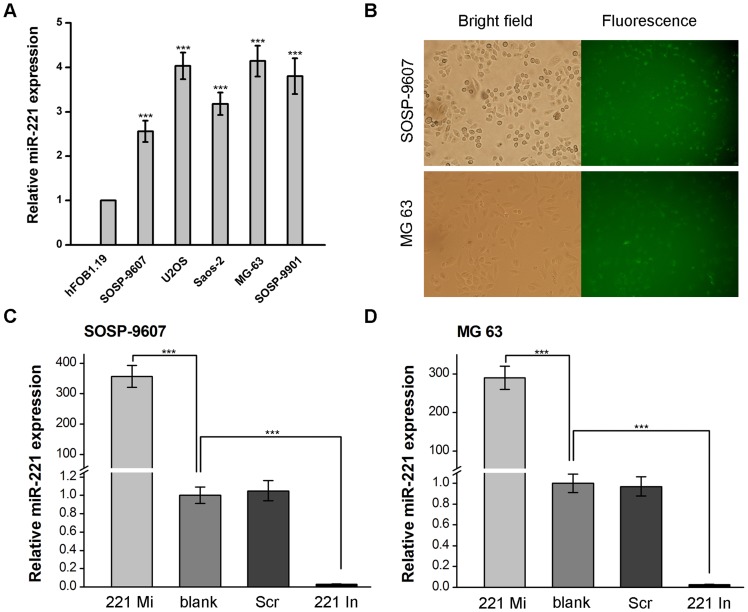
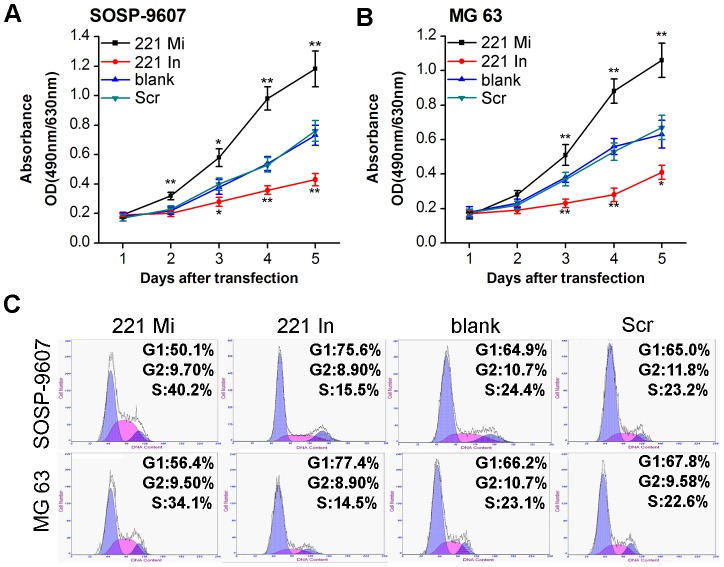
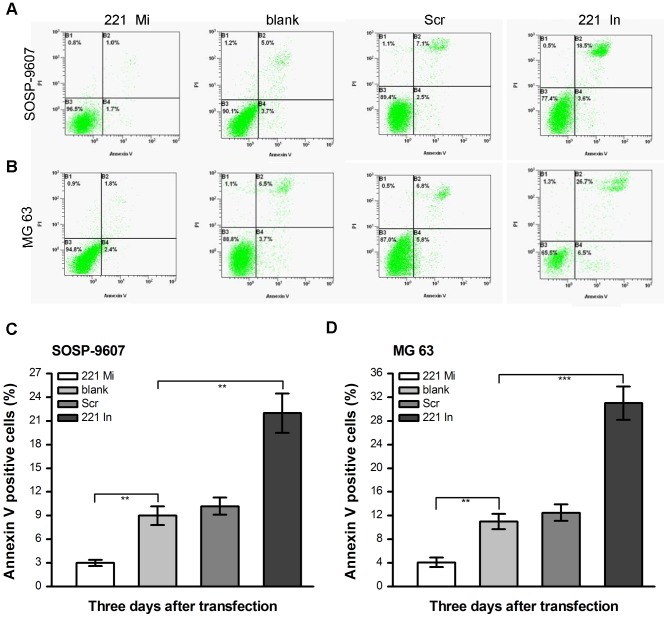
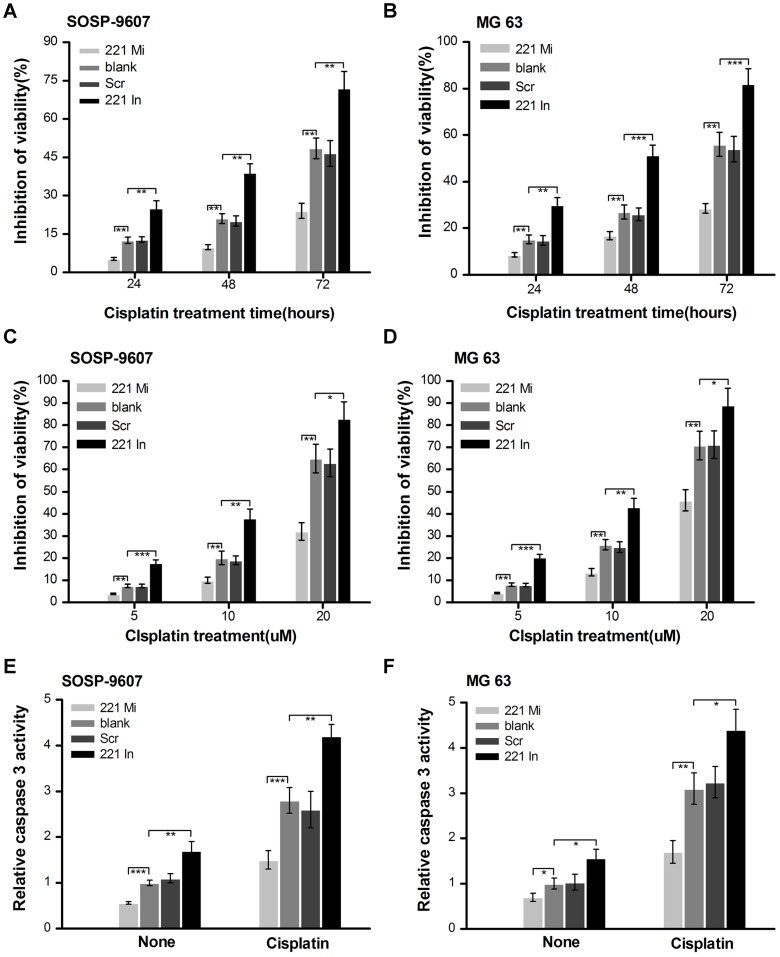
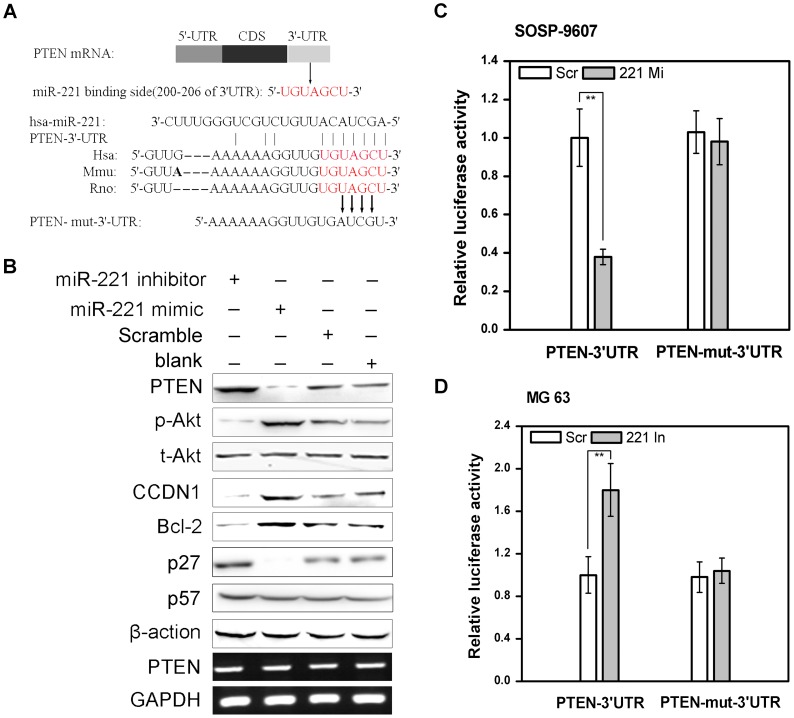
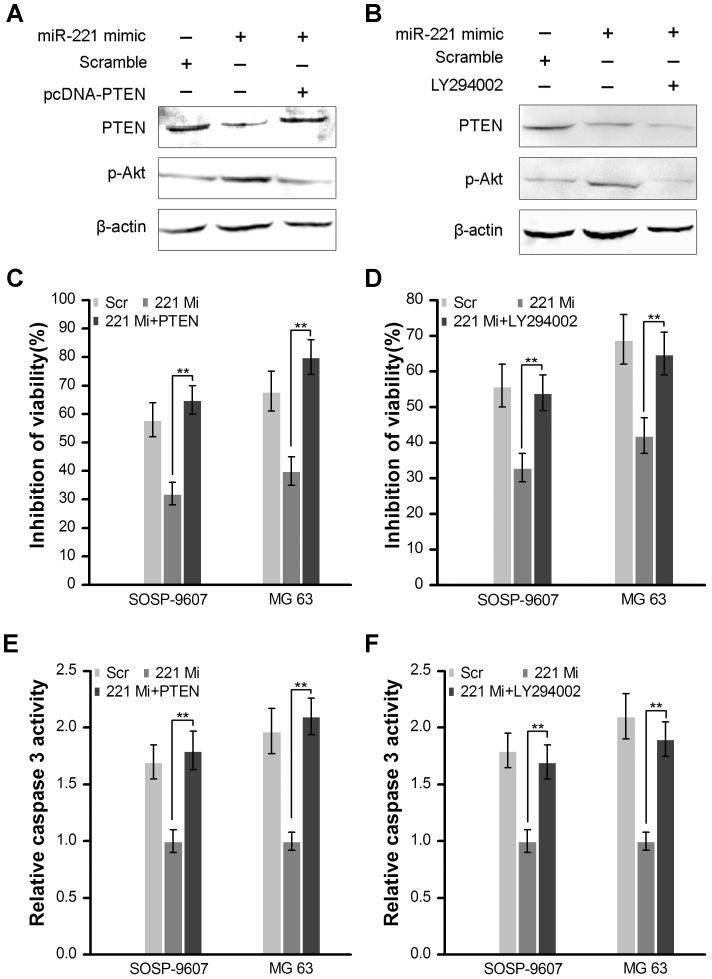
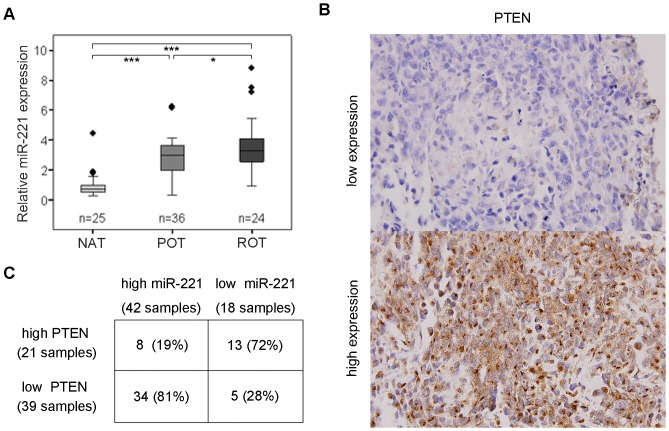
Methodology/principal findings: Real-time quantitative PCR analysis revealed miR-221 was significantly upregulated in osteosarcoma cell lines than in osteoblasts. Both human osteosarcoma cell lines SOSP-9607 and MG63 were transfected with miR-221 mimic or inhibitor to regulate miR-221 expression. The effects of miR-221 were then assessed by cell viability, cell cycle analysis, apoptosis assay, and cisplatin resistance assay. In both cells, upregulation of miR-221 induced cell survival and cisplatin resistance and reduced cell apoptosis. In addition, knockdown of miR-221 inhibited cell growth and cisplatin resistance and induced cell apoptosis. Potential target genes of miR-221 were predicted using bioinformatics. Moreover, luciferase reporter assay and western blot confirmed that PTEN was a direct target of miR-221. Furthermore, introduction of PTEN cDNA lacking 3'-UTR or PI3K inhibitor LY294002 abrogated miR-221-induced cisplatin resistance. Finally, both miR-221 and PTEN expression levels in osteosarcoma samples were examined by using real-time quantitative PCR and immunohistochemistry. High miR-221 expression level and inverse correlation between miR-221 and PTEN levels were revealed in osteosarcoma tissues.
Conclusions/significance: These results for the first time demonstrate that upregulation of miR-221 induces the malignant phenotype of human osteosarcoma whereas knockdown of miR-221 reverses this phenotype, suggesting that miR-221 could be a potential target for osteosarcoma treatment.
Conflict of interest statement
Figures
Similar articles
-
Honokiol suppresses proliferation and induces apoptosis via regulation of the miR‑21/PTEN/PI3K/AKT signaling pathway in human osteosarcoma cells.Int J Mol Med. 2018 Apr;41(4):1845-1854. doi: 10.3892/ijmm.2018.3433. Epub 2018 Jan 29. Int J Mol Med. 2018. PMID: 29393336 Free PMC article.
-
MicroRNA-196a overexpression promotes cell proliferation and inhibits cell apoptosis through PTEN/Akt/FOXO1 pathway.Int J Clin Exp Pathol. 2015 Mar 1;8(3):2461-72. eCollection 2015. Int J Clin Exp Pathol. 2015. PMID: 26045752 Free PMC article.
-
Long noncoding RNA OIP5-AS1 causes cisplatin resistance in osteosarcoma through inducing the LPAATβ/PI3K/AKT/mTOR signaling pathway by sponging the miR-340-5p.J Cell Biochem. 2019 Jun;120(6):9656-9666. doi: 10.1002/jcb.28244. Epub 2018 Dec 11. J Cell Biochem. 2019. PMID: 30548308
-
New emerging targets in osteosarcoma therapy: PTEN and PI3K/Akt crosstalk in carcinogenesis.Pathol Res Pract. 2023 Nov;251:154902. doi: 10.1016/j.prp.2023.154902. Epub 2023 Oct 21. Pathol Res Pract. 2023. PMID: 37922723 Review.
-
MicroRNA dynamics, PTEN/PI3K/AKT signaling, and their relationship to breast cancer: prospects for pharmaceuticals and natural product application.Breast Cancer Res Treat. 2025 Feb;209(3):467-485. doi: 10.1007/s10549-024-07600-7. Epub 2025 Jan 10. Breast Cancer Res Treat. 2025. PMID: 39792295 Review.
Cited by
-
miRNA-221 and miRNA-222 induce apoptosis via the KIT/AKT signalling pathway in gastrointestinal stromal tumours.Mol Oncol. 2015 Aug;9(7):1421-33. doi: 10.1016/j.molonc.2015.03.013. Epub 2015 Apr 10. Mol Oncol. 2015. PMID: 25898773 Free PMC article.
-
Roles of Mir-144-ZFX pathway in growth regulation of non-small-cell lung cancer.PLoS One. 2013 Sep 16;8(9):e74175. doi: 10.1371/journal.pone.0074175. eCollection 2013. PLoS One. 2013. PMID: 24066116 Free PMC article.
-
Drug resistance-related microRNAs in osteosarcoma: Translating basic evidence into therapeutic strategies.J Cell Mol Med. 2019 Apr;23(4):2280-2292. doi: 10.1111/jcmm.14064. Epub 2019 Feb 5. J Cell Mol Med. 2019. PMID: 30724027 Free PMC article. Review.
-
miR‑10a increases the cisplatin resistance of lung adenocarcinoma circulating tumor cells via targeting PIK3CA in the PI3K/Akt pathway.Oncol Rep. 2020 Jun;43(6):1906-1914. doi: 10.3892/or.2020.7547. Epub 2020 Mar 17. Oncol Rep. 2020. PMID: 32186774 Free PMC article.
-
Overcoming cisplatin resistance in osteosarcoma through the miR-199a-modulated inhibition of HIF-1α.Biosci Rep. 2019 Nov 29;39(11):BSR20170080. doi: 10.1042/BSR20170080. Biosci Rep. 2019. PMID: 28442599 Free PMC article.
References
-
- Marina N, Gebhardt M, Teot L, Gorlick R (2004) Biology and therapeutic advances for pediatric osteosarcoma. Oncologist 9: 422–441. - PubMed
-
- Kim VN (2005) Small RNAs: classification, biogenesis, and function. Mol Cells 19: 1–15. - PubMed
-
- Bartel DP (2004) MicroRNAs: genomics, biogenesis, mechanism, and function. Cell 116: 281–297. - PubMed
-
- Lee RC, Feinbaum RL, Ambros V (1993) The C. elegans heterochronic gene lin-4 encodes small RNAs with antisense complementarity to lin-14. Cell 75: 843–854. - PubMed
Publication types
MeSH terms
Substances
LinkOut - more resources
Full Text Sources
Other Literature Sources
Medical
Research Materials
